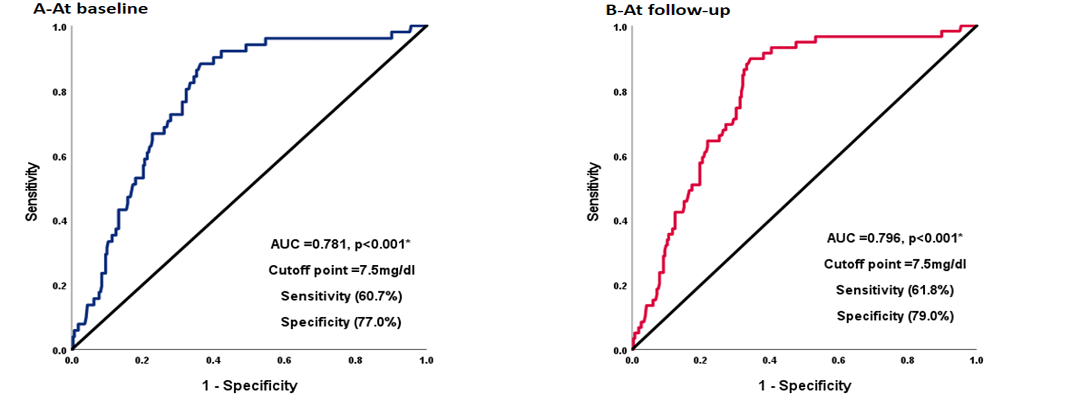
Roc curve analyses of serum uric acid for the prediction of kidney impairment at baseline compared to at follow up