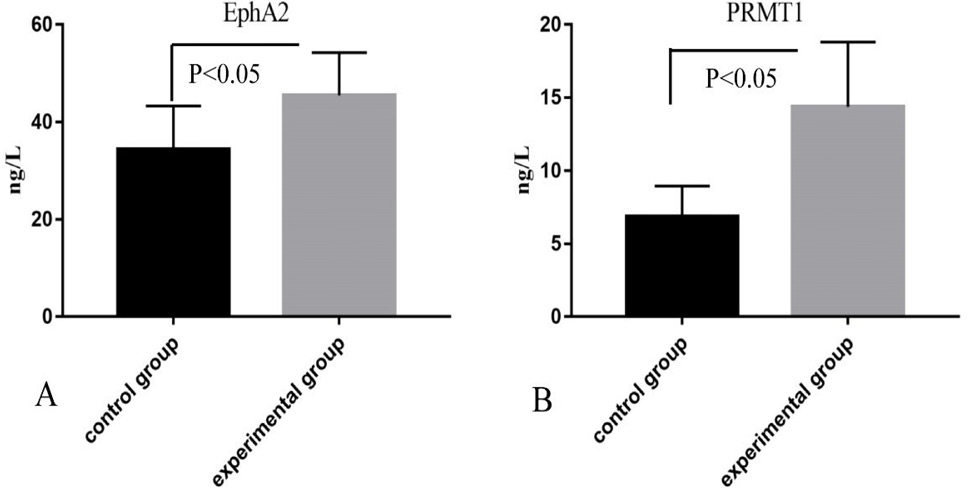
Fig. 1.
The relative levels of EphA2 and PRMT1 of blood samples (A, B) and BALF samples (C, D, E, F, G) of control and experimental group as determined by ELISA (A, B), Western blotting (C, D) and RT-PCR (F, F). The values are presented as means ± standard deviation. The data of two groups were compared using t test. *P<0.05 represented statistically significant.