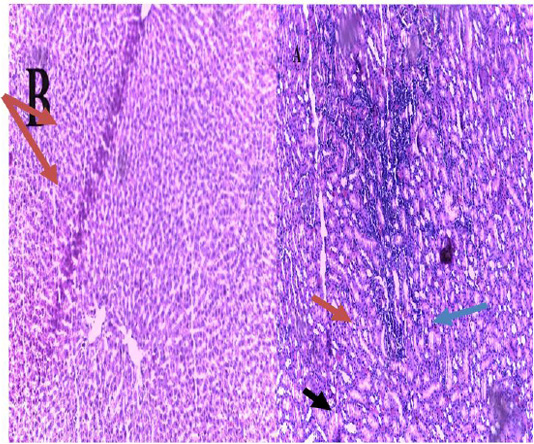
Figure 5:
Section in the kidney of Puma group (Three months) showing (A): sever infiltration of inflammatory cells (red arrow). (B): Section in the liver of control group showing central vein (red arrow) hepatocytes (blue arrow) sinusoids (black arrow), stained by H & E, (A), (B) (40 X).