
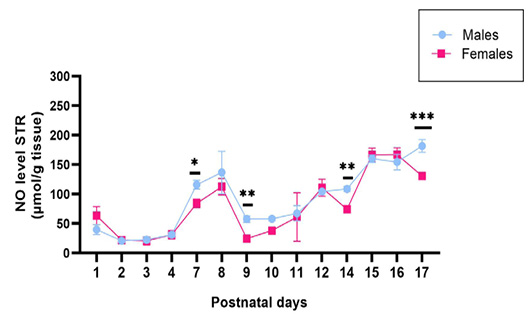
Figure 3:
The graphic shows the Kinetics of the NO release in the Striatum area from male and female animals, for each postnatal day analyzed (PND1 to PND17). Error bars represent the standard deviation of the means. The significance level is 0.05.*p < 0.05.