
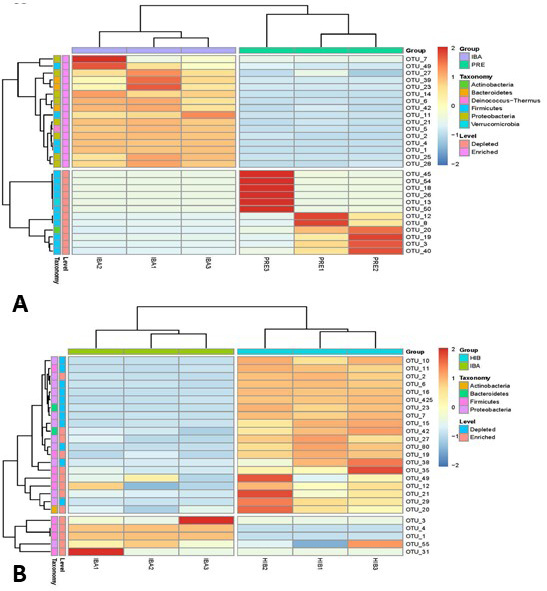
Fig. 10.
Heatmap of the OTUs with significantly different abundances in IBA, PRE, and HIB groups.
A, Significant difference in the OTU abundance between IBA and PRE groups. B, Significant difference in the OTU abundance between IBA and HIB groups.