Figure 1:
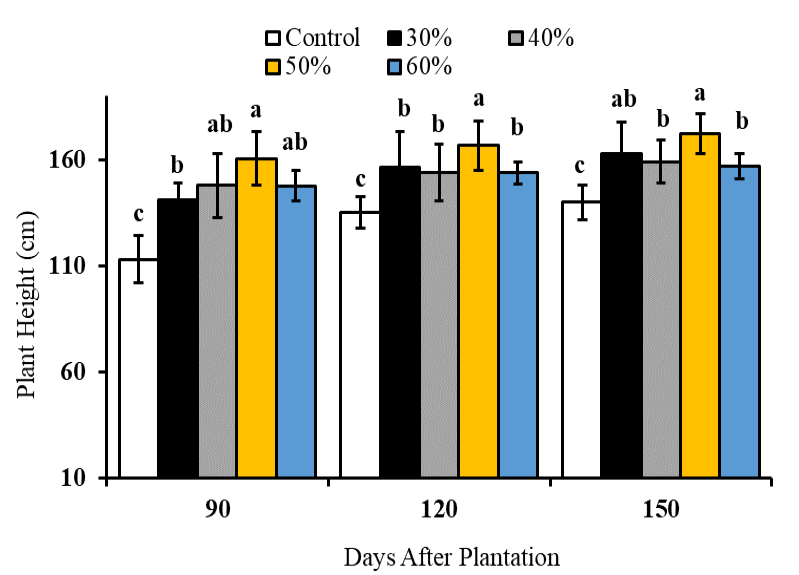
Graphical presentation of plant growth/height of the sugarcane treated with different concentrations of spent washes. The Y-axis shows plant height in centimeter (cm) and the X-axis days after plantation (DAP).
Graphical presentation of plant growth/height of the sugarcane treated with different concentrations of spent washes. The Y-axis shows plant height in centimeter (cm) and the X-axis days after plantation (DAP).