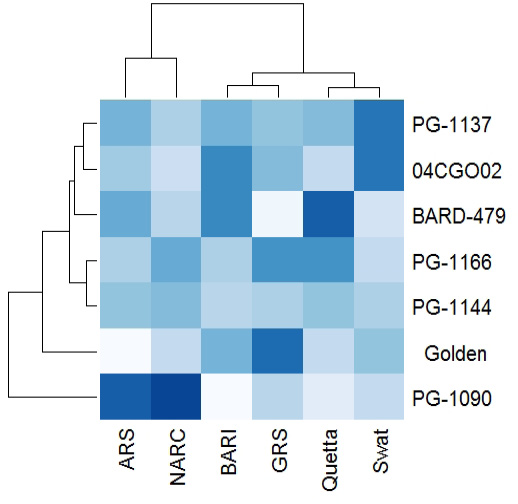
Figure 4:
The heat map showing the yield differences at different locations. Lighter color showed the lower yields while the darker one expressed the higher ones. e.g. at NARS the most darker color is shown in PG-1090 having DPY (3875 kg ha-1) while the most lighter one shown against BARD-479 having DPY (1184 kg ha-1).