View larger version:
Download Original File
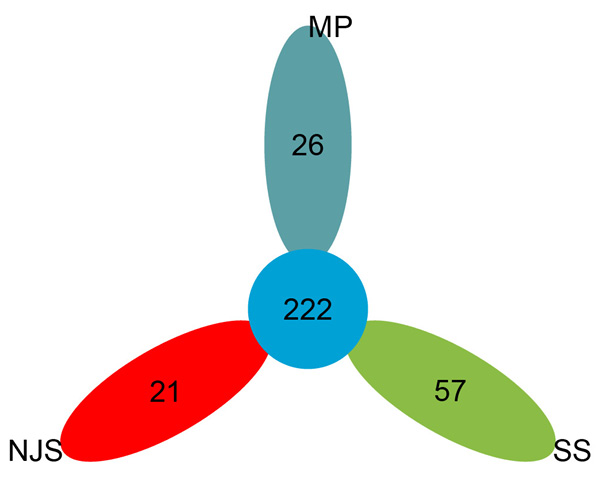
Fig. 2.
Venn diagram showing the unique and shared OTUs in three sampling sites.