
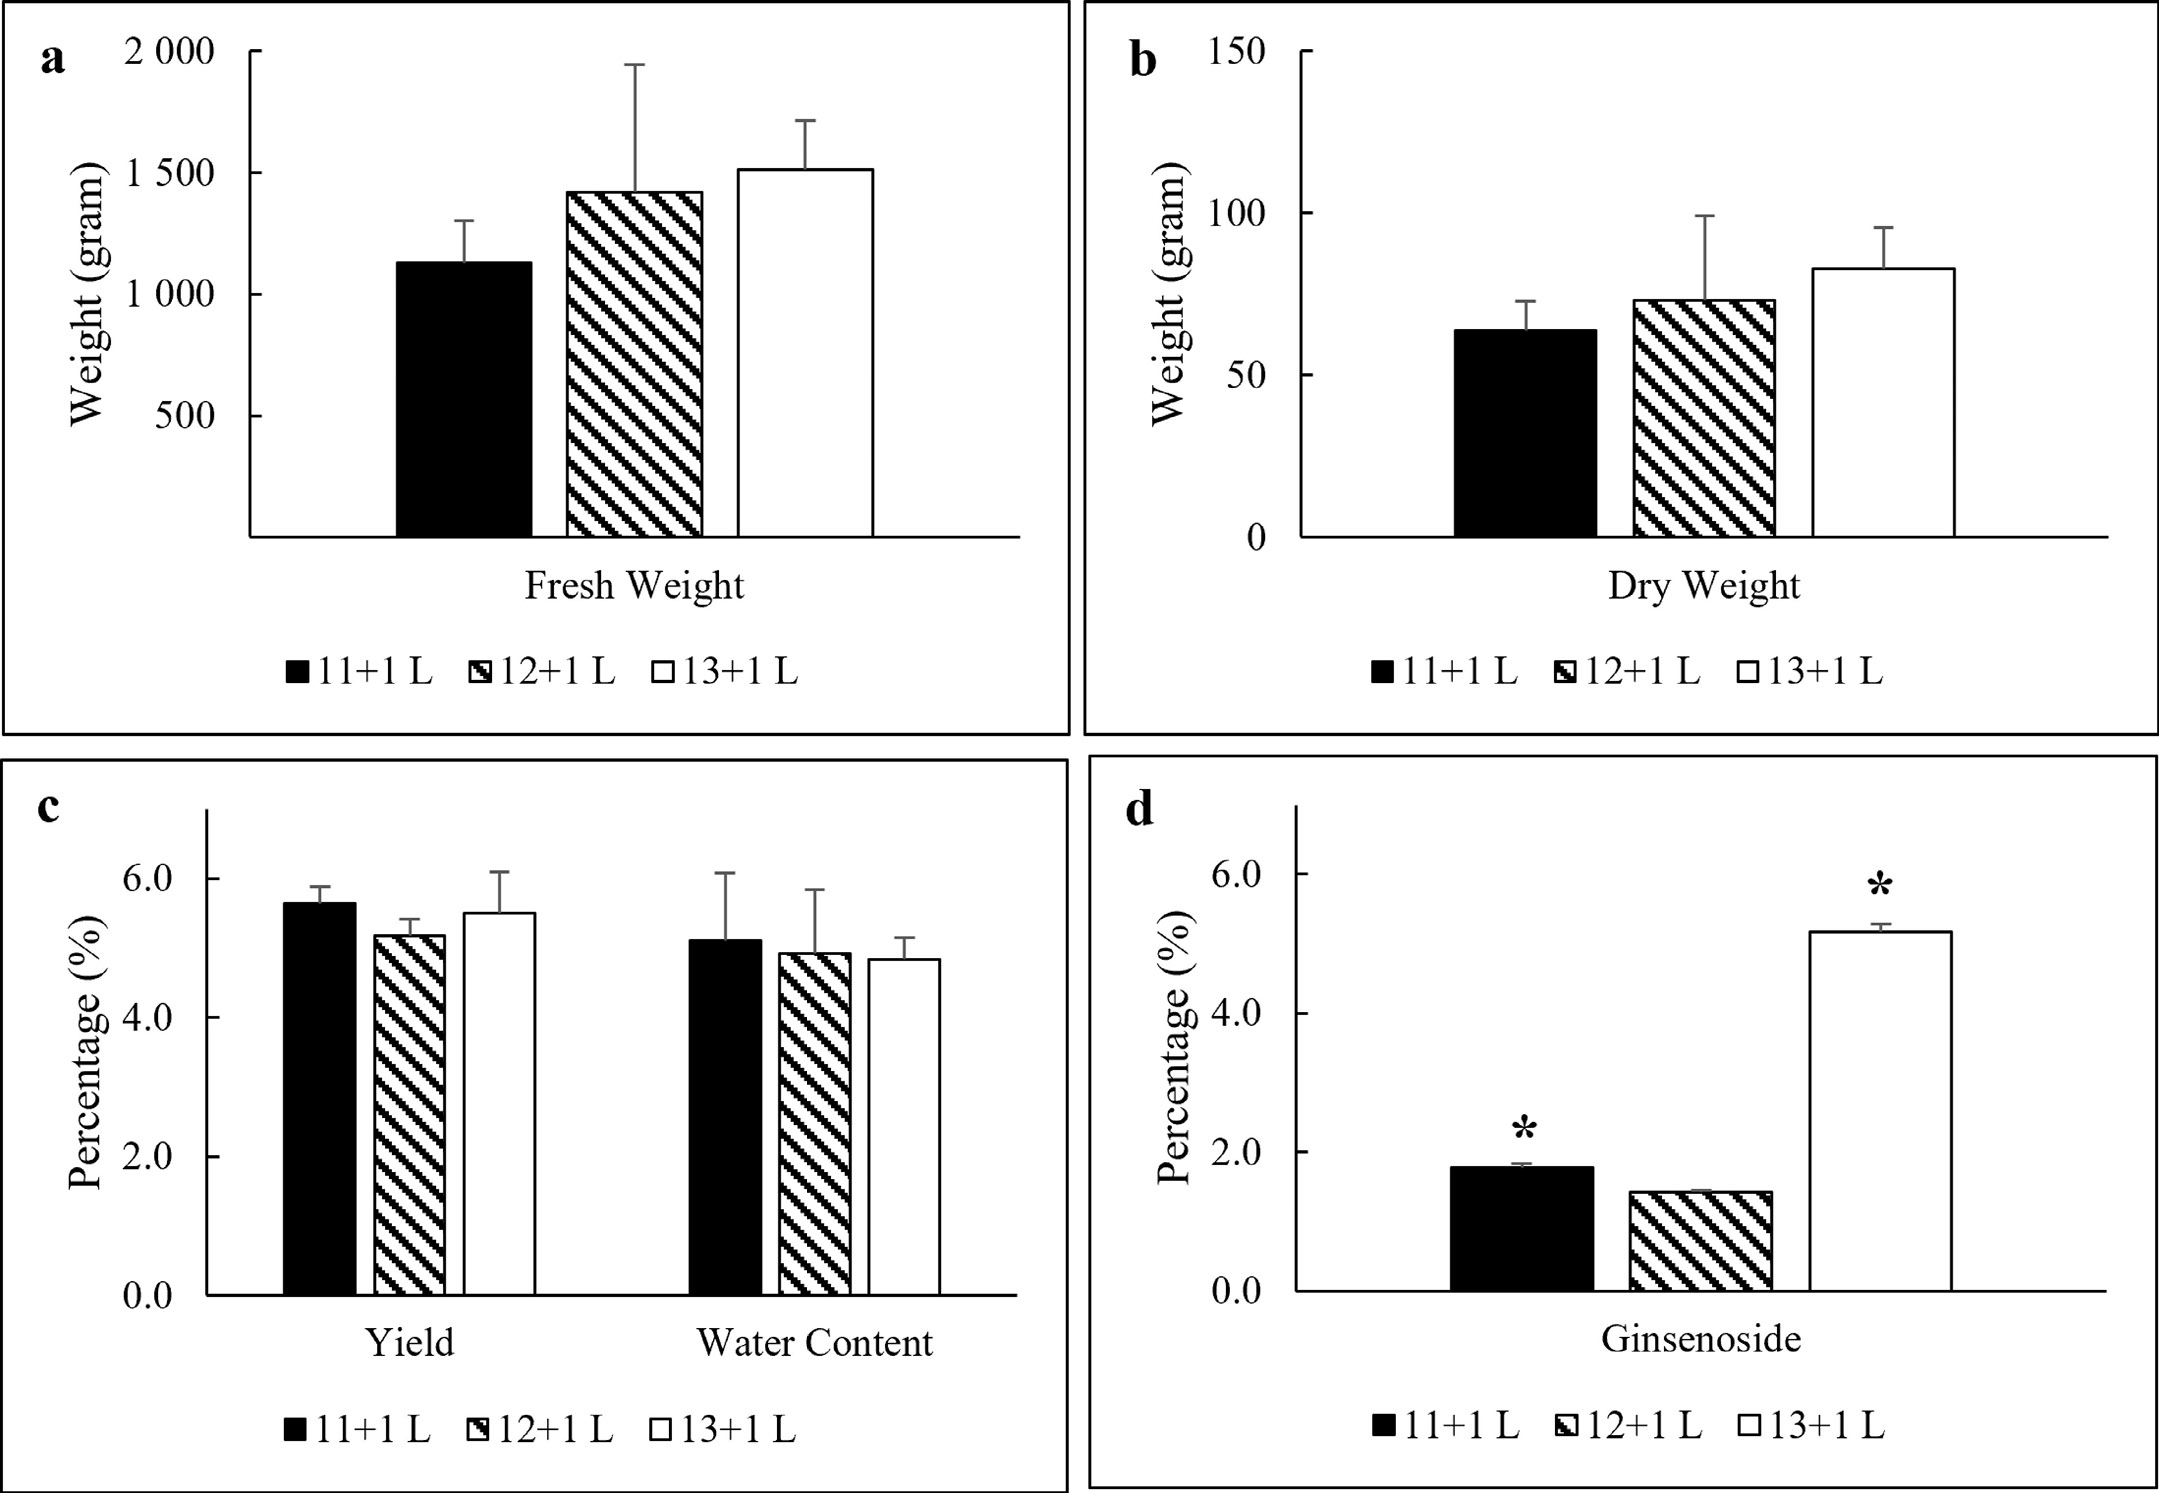
Figure 2:
Bar chart of the effect of medium volume on a) fresh weight, b) dry weight, c) yield percentage and water content, and d) ginsenoside content. Values are means ± SD (n = 3). Significant differences are marked with (*) and (**) (P < 0.05 % and P < 0.01 %, respectively).