View larger version:
Download Original File
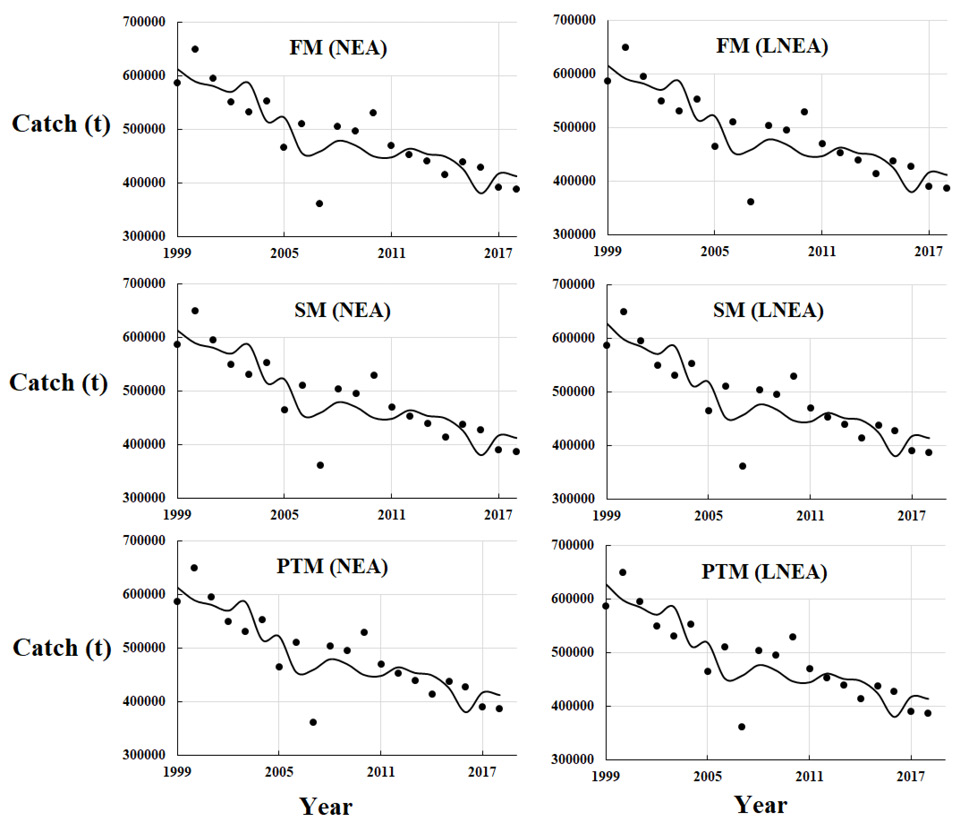
Fig. 3.
CEDA residual plots (IP 0.9).
Catch given in t (Dots = reported catch and straight line= estimated catch).
