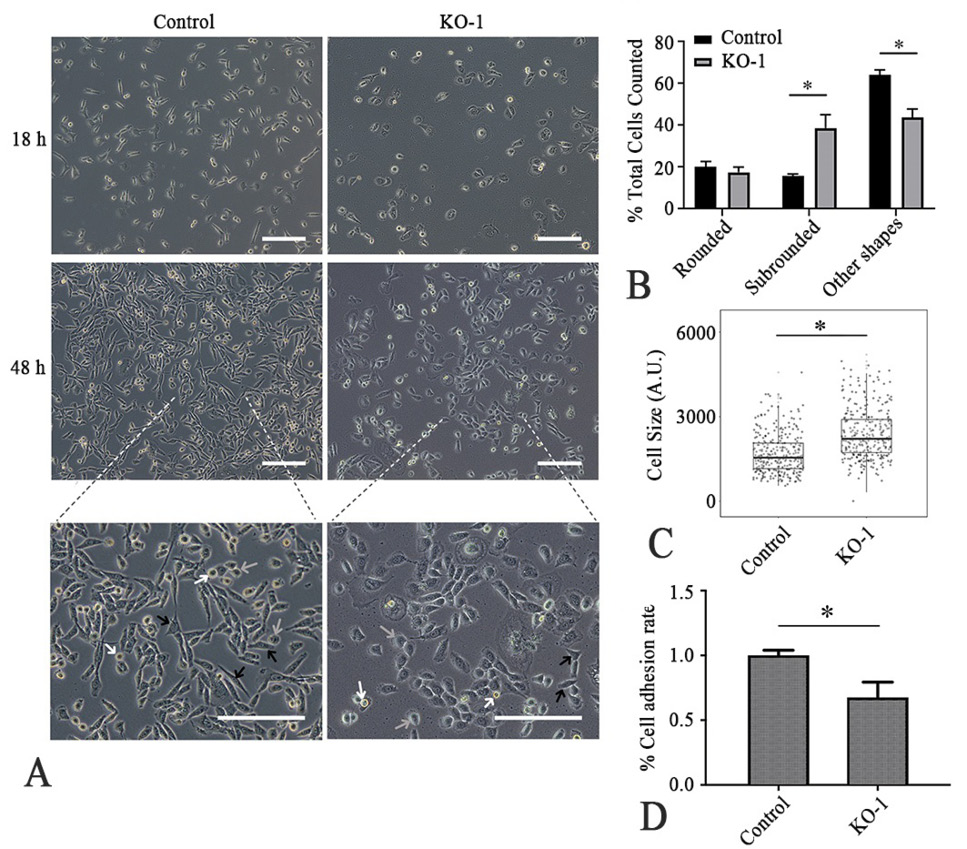
Fig. 3.
Morphological and adhesion change of GTCs after knockout Grp78. (A) Cells were harvested at 48 hr post-transfection and re-seeded on a 24-well plate. Changes in morphology were analyzed at 18 hr and 48hr after seeding by phase-contrast microcopy. White arrows denote rounded cells, gray arrows denote subrounded cells, and black arrows denote the other shapes cells. (B) Percentage of three types of cells in the total cells observed. (C) Comparison of cell size between KO-1 cells and control cells. (D) The statistical graph of cell adhesion rates. Scale bar = 200 μm.*p<0.05 versus control group.