
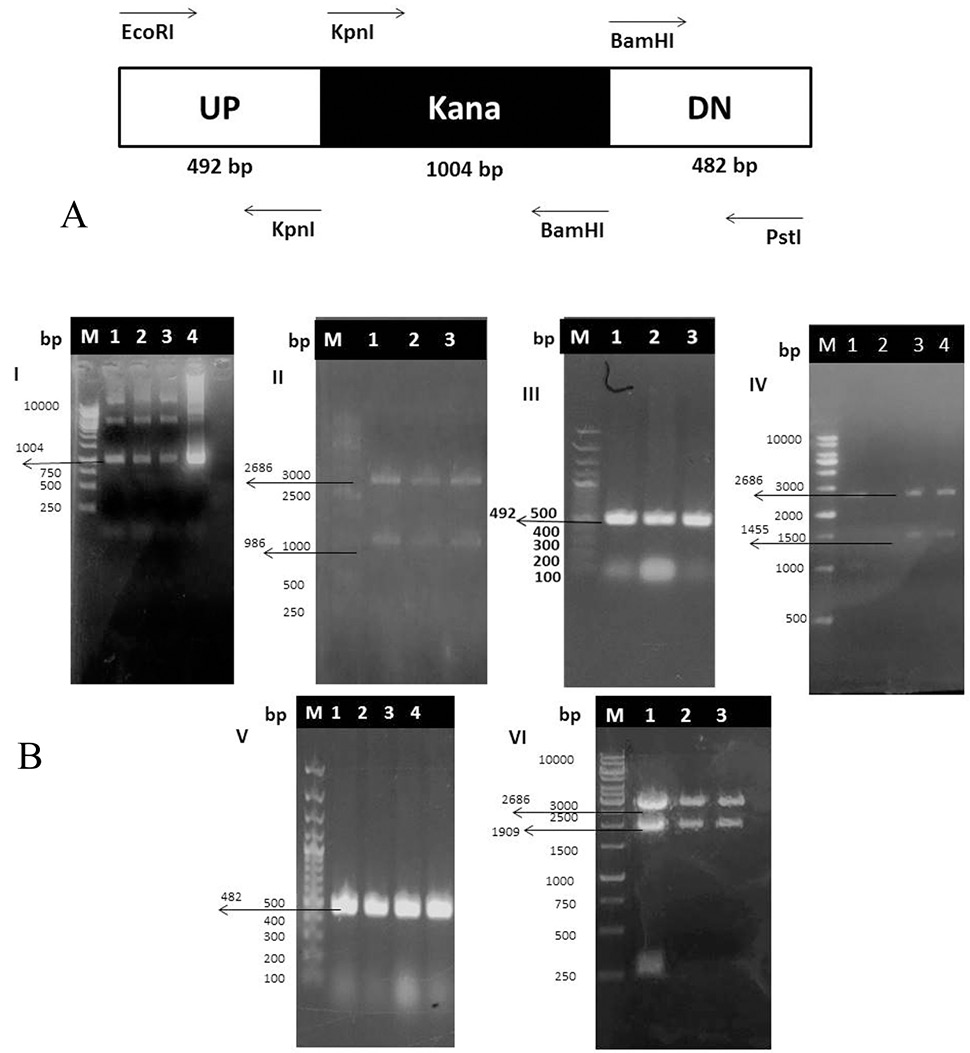
Construction and confirmation of pUC19-K-UP-DN gene deletion cassette. A, Illustration of map of pUC19-K-UP-DN gene deletion plasmid cassette; B I, Amplification of KM fragment. Line M showed 1Kb ladder; Line 1,2,3 showed 1004 bp KM amplicons; B II, Restriction digest analysis of pUC19-K. Line M showed 1Kb ladder; Line 1,2,3 showed transformed E.coli DH5α cells having 2686 bp band of pUC19 and 986 bp band of KM; B III, Amplification of UP fragment. Line M showed 100bp ladder; Line 1,2,3 showed 492 bp UP amplified amplicons; B IV, Restriction digest analysis of pUC19-K-UP. Line M showed 1Kb ladder; Line 1,2,3 showed transformed E. coli DH5α cells having 2686 bp band of pUC19 and 1455 bp band of K-UP fragment; B V, Amplification of DN fragment. Line M showed 100bp ladder; Line 1,2,3 showed 482 bp DN amplified amplicons; B VI, Restriction digest analysis of pUC19-K-UP-DN. Line M showed 1Kb ladder; Line 1,2,3 showed transformed E.coli DH5α cells having 2686 bp band of pUC19 and 1909 bp band of K-UP-DN fragment.