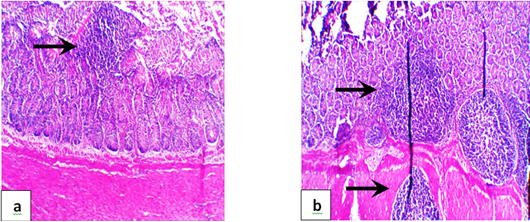
Figure 4:
Representative photomicrograph of gander intestine in control group (G1) showing focal of cellular infiltrates (a & b) in the intestinal crypts to multifocal of cellular infiltrates (b) in the intestinal crypts and tunic submucosa. (H & E, x400).