
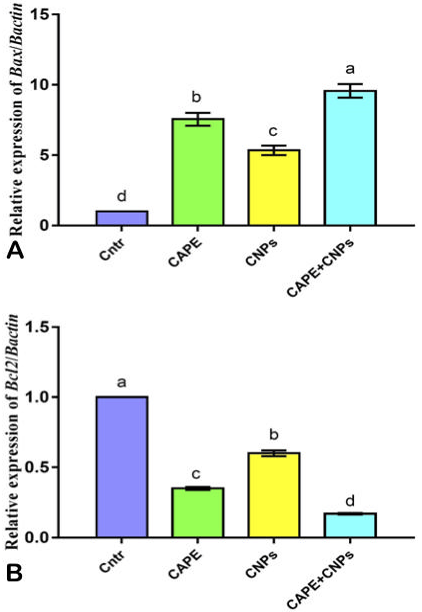
Fig. 3.
Effect of CAPE and/or CNPs on the expression of Bax (A) and Bcl2 (B) genes in HepG2 cells as detected by qPCR. Cells were treated with CAPE and CNPs alone or in combination (CAPE+CNPs) at doses of their IC50 and incubated for 24 h. Data were presented in the form of fold change mean ± SEM, n = 5/group. Different letters above means (as presented by columns plus error bars) refer to significant differences at P<0.05. All groups compared to each other.