View larger version:
Download Original File
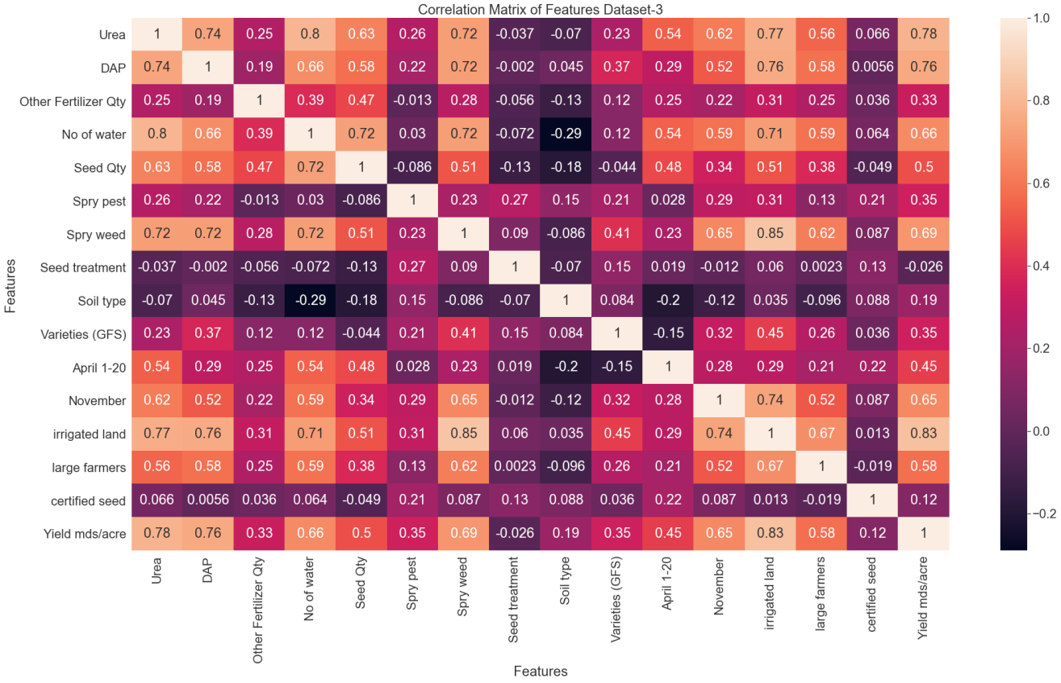
Figure 6:
Heat plot map of correlation matrix for D3.