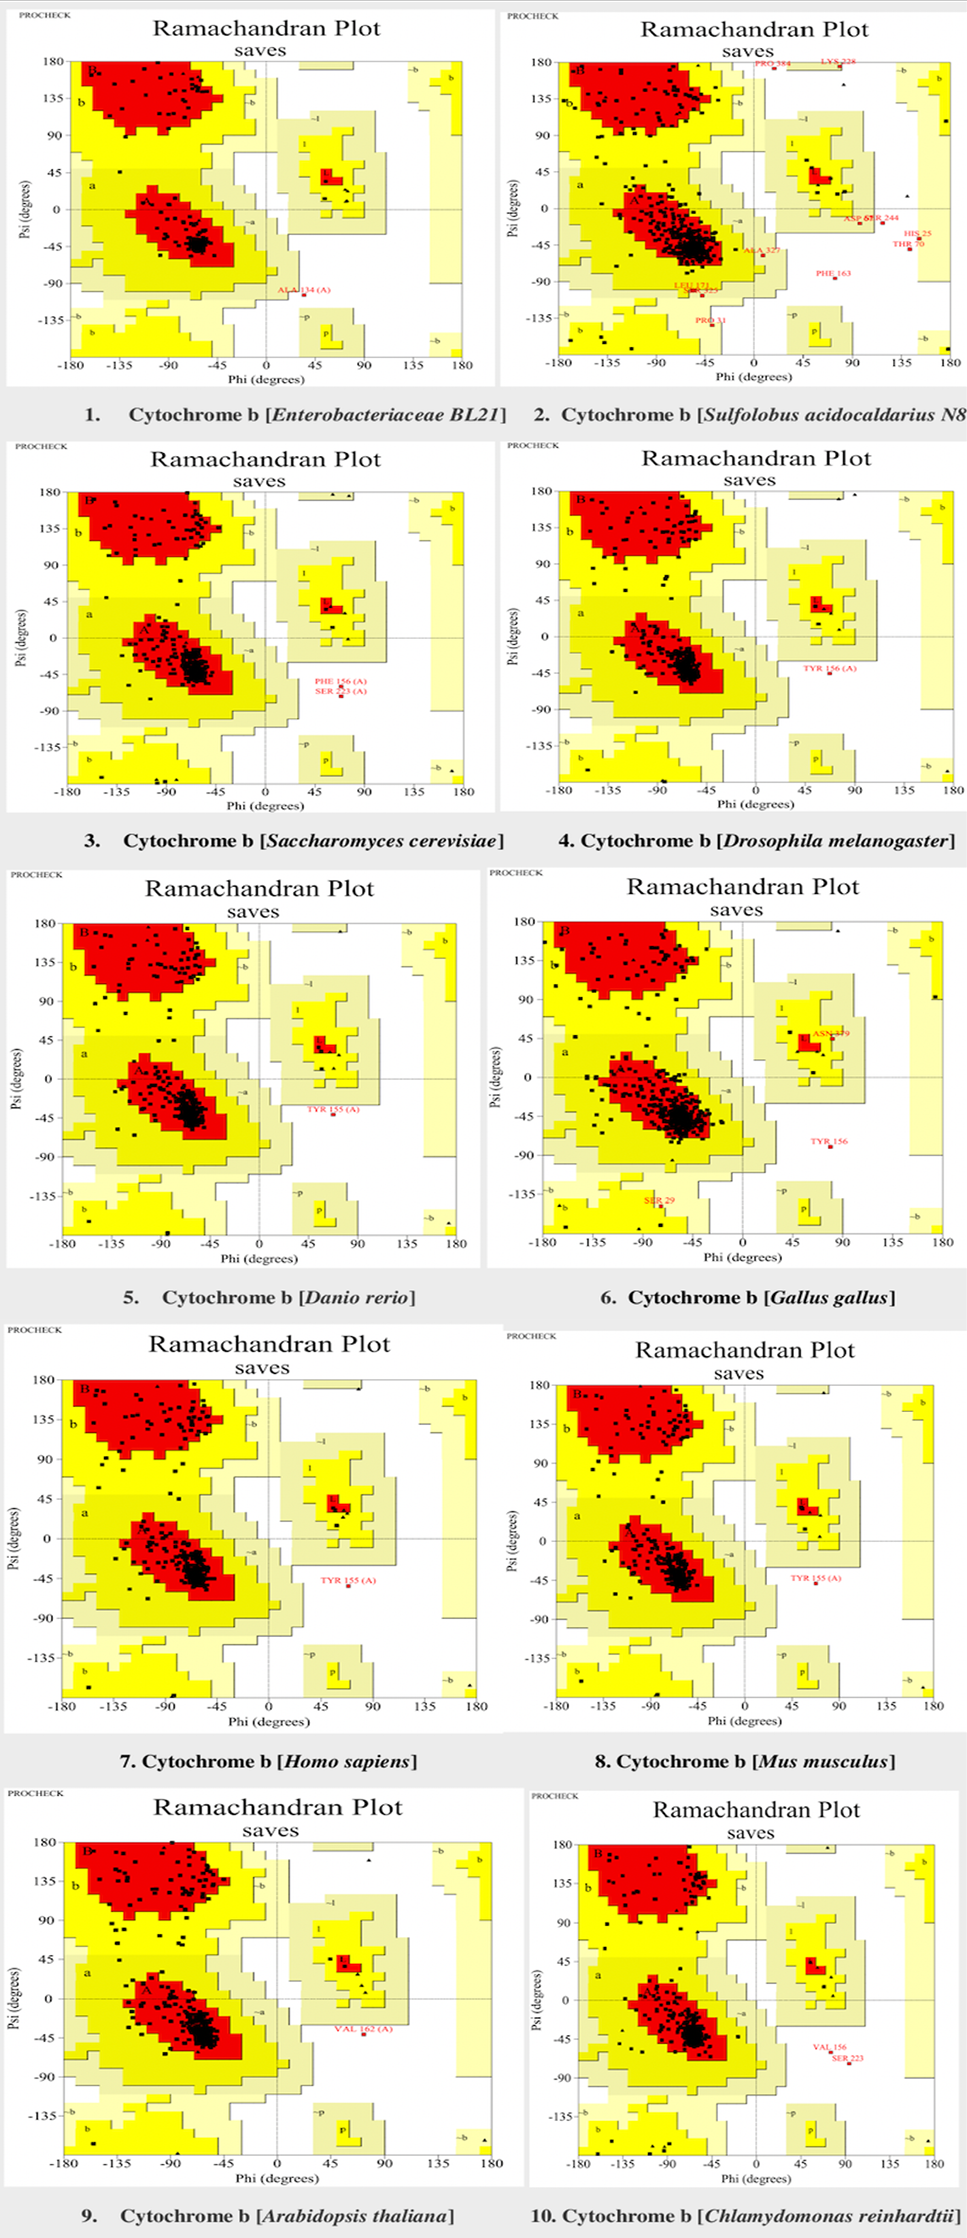
Fig. 7.
Verification of cytochrome b models in selected model organisms through Ramachandran plot. Red colour showed the most favoured region (A, B, L). Yellow colour shows the additional allowed region (a, b, l, p). Generally allowed region (~a, ~b, ~l, ~p) is highlighted in light yellow colour. The Ramachandran plots were generated through procheck tool.
