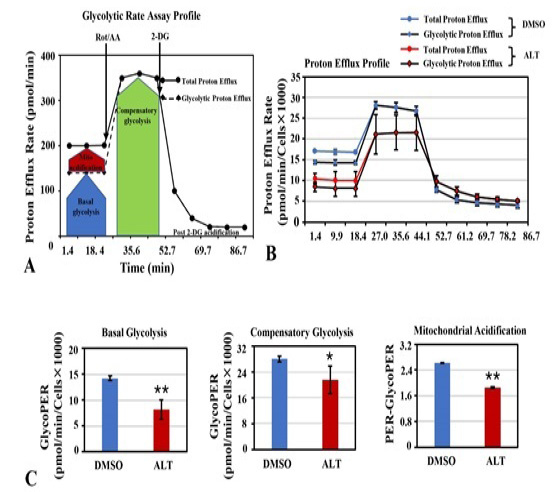
Fig. 4.
Analysis of glycolysis. (A) A schematic diagram of assay workflow showing proton efflux rate (PER) measured with glycolytic rate assay. (B) Comparison of total proton efflux rate and glycolytic proton efflux rates between DMSO treated and ALT treated A2780 cells. (C) Basal glycolysis, compensatory glycolysis and mitochondrial acidification was quantified as described in methodology.