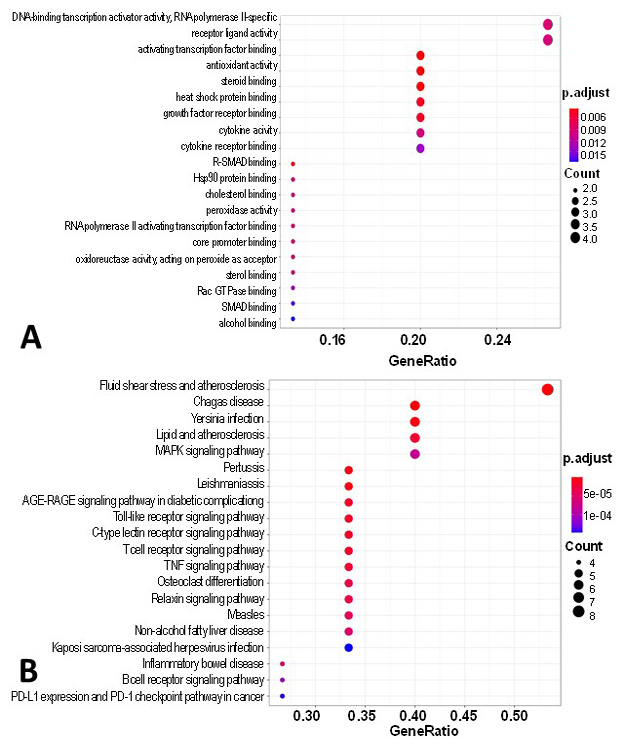
Fig. 1.
Functional enrichment analysis of the therapeutic targets of OR against stress. (A) The top 20 GO-BP terms; (B) The top 20 KEGG pathway terms.
The circle size represents the count of therapeutic targets enriched in a certain pathway; the associated genes (%) means the percentage of target genes to the background genes of a certain pathway.
