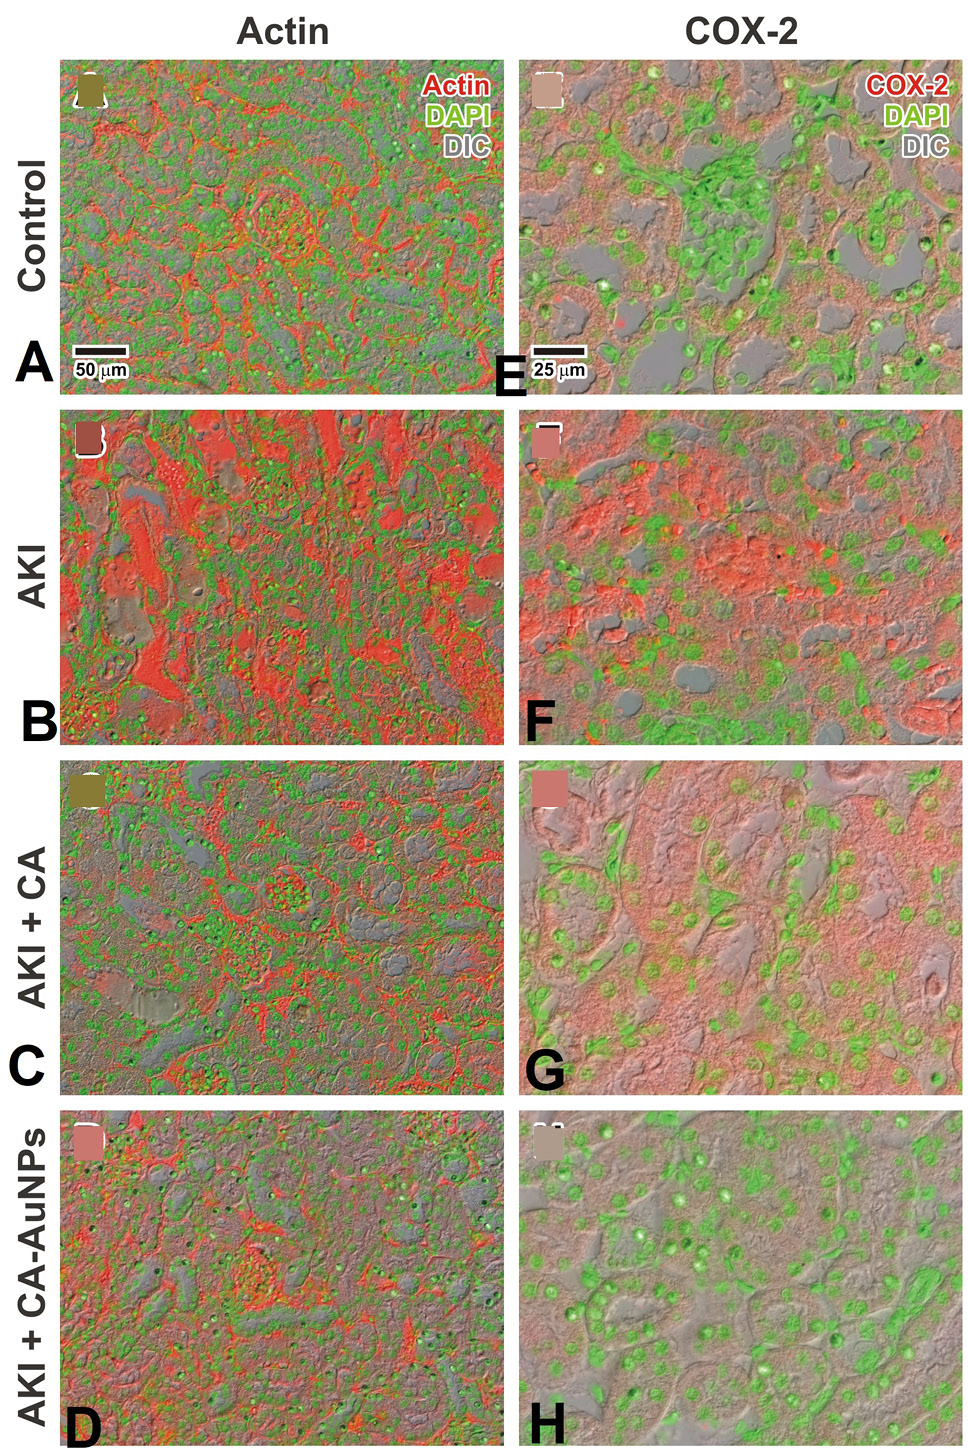
Fig. 6.
CA and CA-AuNPs prevent damage in actin cytoskeleton and reduces expression of COX-2. Normal distribution of actic can be seen in figure A while figure B shows disrupted actin cytoskeleton. The protection of actin cytoskeleton can be observed in figure C and D which were treated with CA and CA-AuNPs respectively. (Magnification; 200x). There is no expression of COX-2 in normal control (E) whereas higher expression level can be observed in glycerol treated AKI group (F). A decrease expression of COX-2 can be noticed in CA (G) and CA-AuNPs (H) treated groups. Red is actin and COX-2, green is DAPI and gray is DIC image. (Magnification; 600x).