
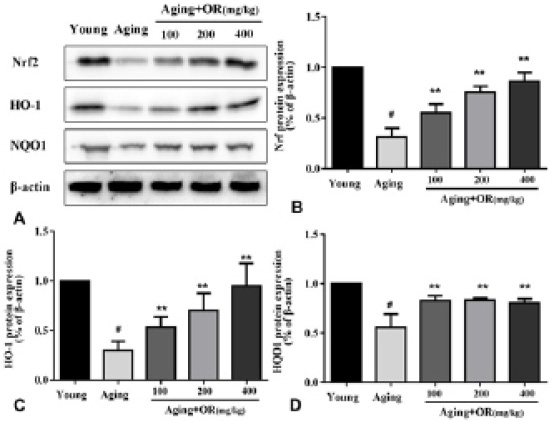
Fig. 4.
The effect of OR on the Nrf2 pathway in aging mice. Nrf2, HO-1 and NQO1 expression were analyzed by western blot (A), Quantification graphs of Nrf2, HO-1 and NQO1 are shown on (B), (C) and (D). Compared with the young mice group, #P<0.05; compared with the aging mice group, **P<0.01.