View larger version:
Download Original File
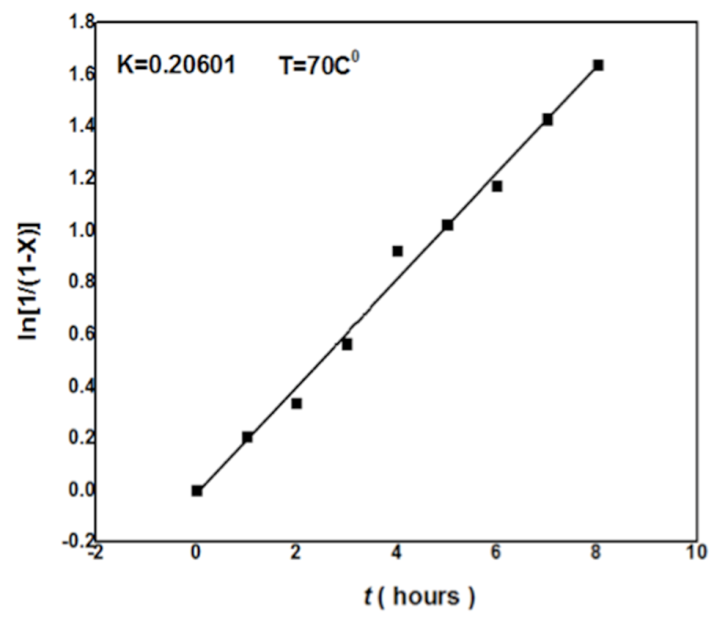
Figure 5:
Graph between time (Hrs) and ln[1/(1-X)] at 70oC showing value of k.
