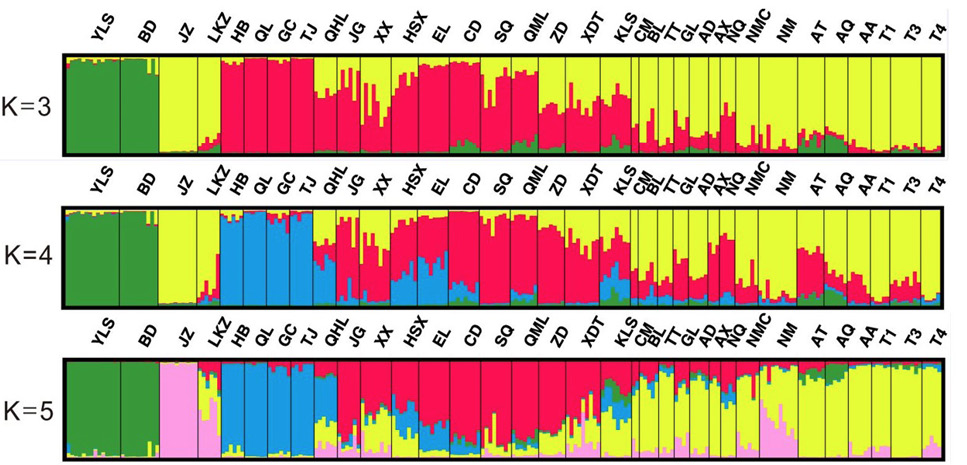
Fig. 5.
Bayesian individual-based clustering of pika populations with K, 3; K, 4 and K, 5. Each individual is represented by a single vertical bar divided into K colors. The colored segments shows the estimated proportion of membership to each genetic cluster.