View larger version:
Download Original File
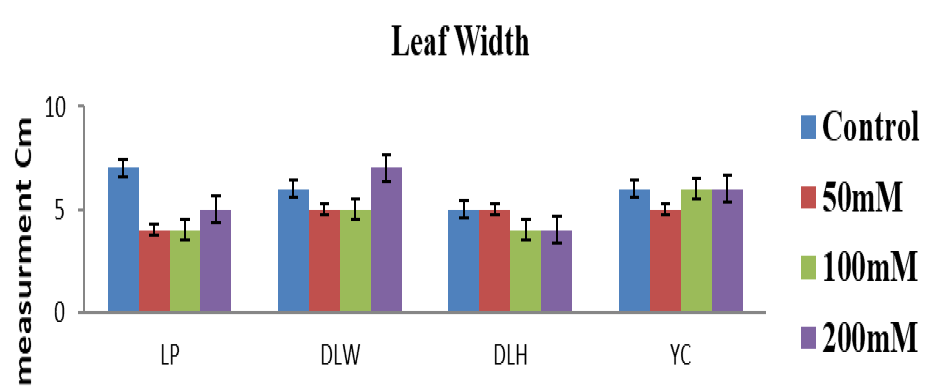
Figure 3:
Graphical representation of Leaf width of four different regions under control and salt stress.