View larger version:
Download Original File
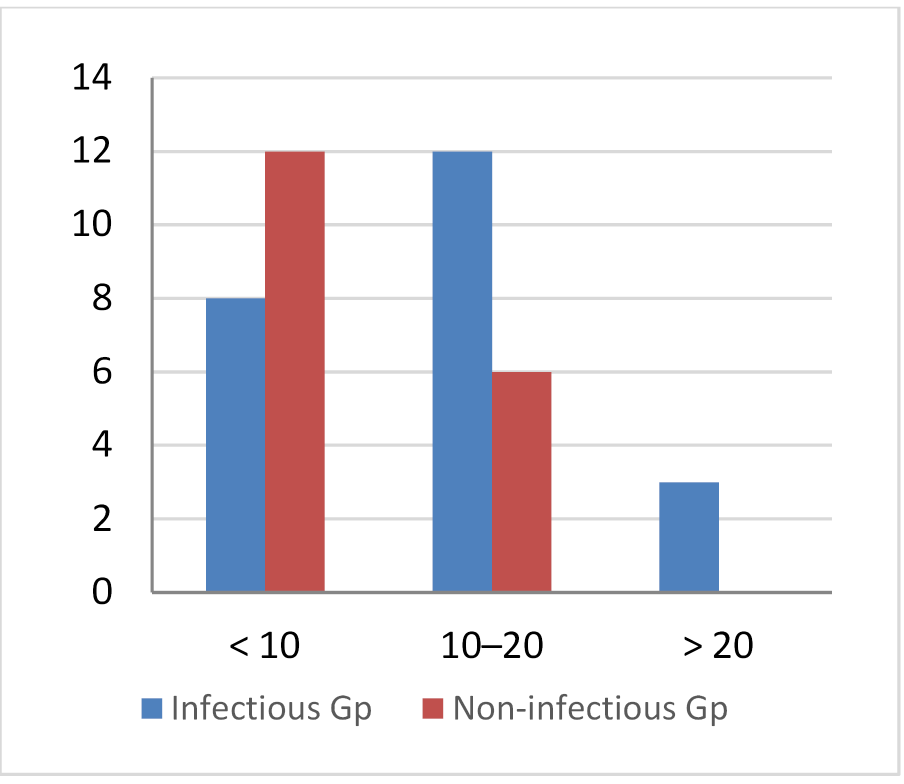
Figure 4:
The SOFA scale among both groups in this study.