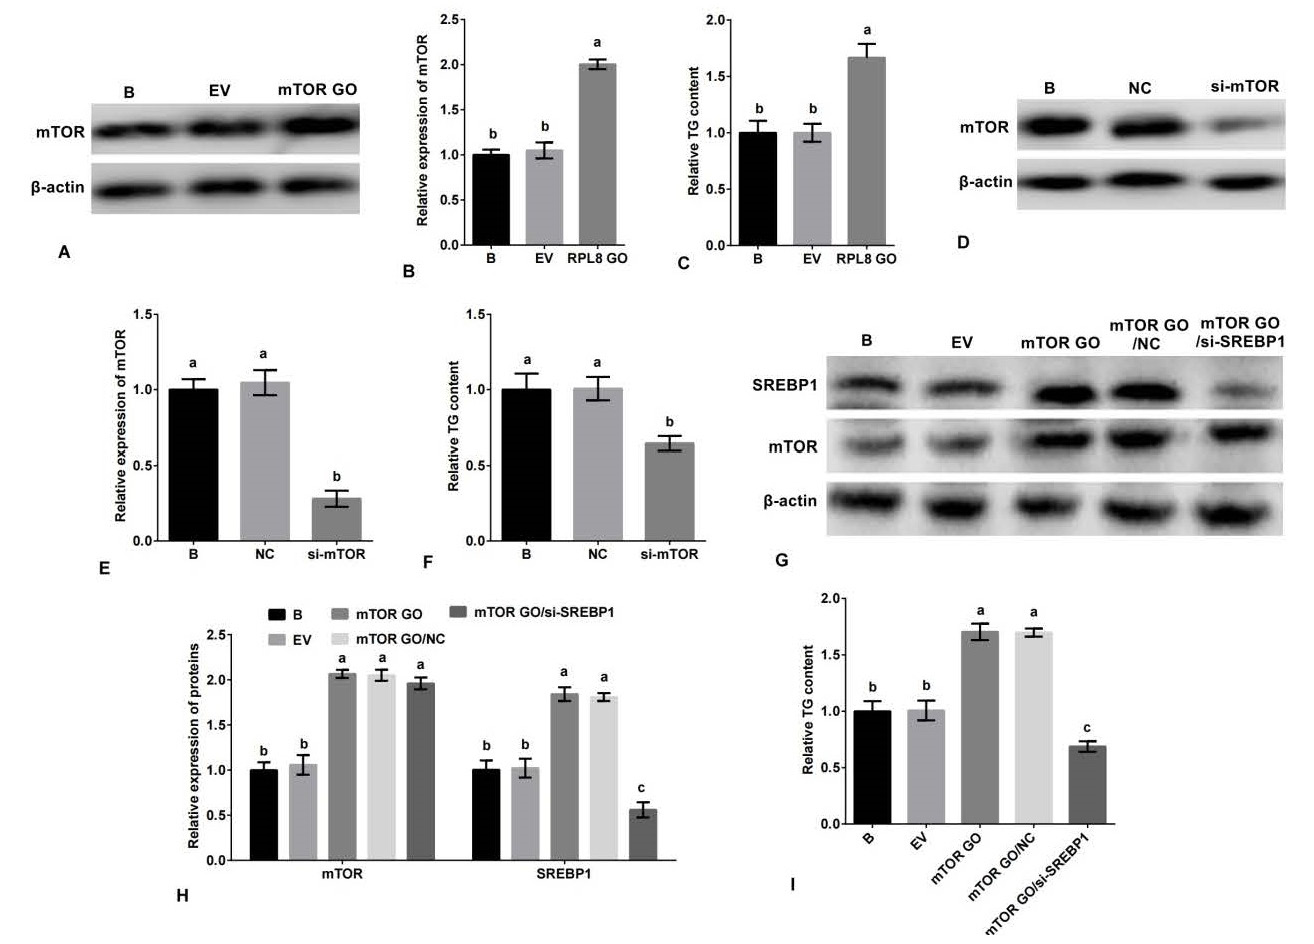
mTORC1 promotes milk fat synthesis in YMECs through the SREBP1 pathway. Specifically, the expression of mTOR in YMECs treated with mTOR overexpression is shown in A-B, while C displays the secretion of TG in YMECs treated with mTOR overexpression. The expression of mTOR in YMECs treated with mTOR silencing is depicted in D-E, and F shows the secretion of TG in YMECs treated with mTOR silencing. The expression of mTOR and SREBP1 in YMECs treated with mTOR overexpression or mTOR overexpression/SREBP1 silencing is shown in G-H, while I displays the secretion of TG in YMECs treated with mTOR overexpression or mTOR overexpression/SREBP1 silencing. In B, E, and H, the expression of mTOR or/and SREBP1 in the “B” group was set to “1”. In C, F, and I, the secretion of TG in the “B” group was set to “1”. The experimental groups were categorized as B (non-transfected cells), EV (cells transfected with empty vector), mTOR GO (cells transfected with mTOR overexpression vector), NC (cells transfected with negative control siRNA), si-mTOR (cells transfected with mTOR siRNA), and mTOR GO/si-SREBP1 (cells co-transfected with mTOR overexpression vector and SREBP1 siRNA). The bar charts display superscript letters indicating significant differences (p<0.05) between different experimental groups, while identical letters indicate no significant difference (p>0.05).