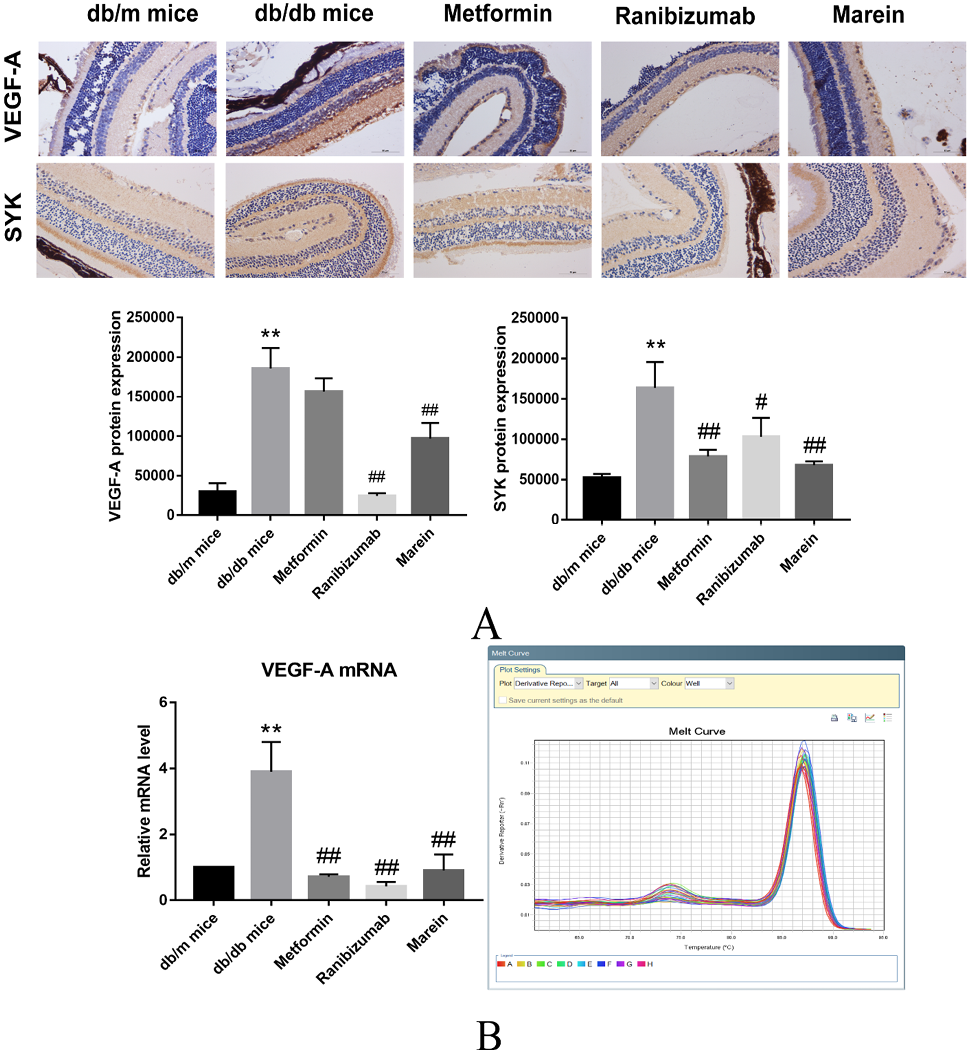
Fig. 3.
A: Immunohistochemical staining of VEGF-A and SYK in experimental mice retinal tissue (200×). Note: The values were expressed as `x ± SEM, n ≥ 6, *P < 0.05, **P < 0.01 indicated statistical significance compared with the control group. #P < 0.05, ##P < 0.01 indicated statistical significance compared with the model group; B: Effect of Marein on mRNA levels of retinopathy related proteins in retinal tissue of db/db mice. Note: The values were expressed as `x ± SEM, n ≥ 6, *P < 0.05, **P < 0.01 indicated statistical significance compared with the control group. #P < 0.05, ##P < 0.01 indicated statistical significance compared with the model group.