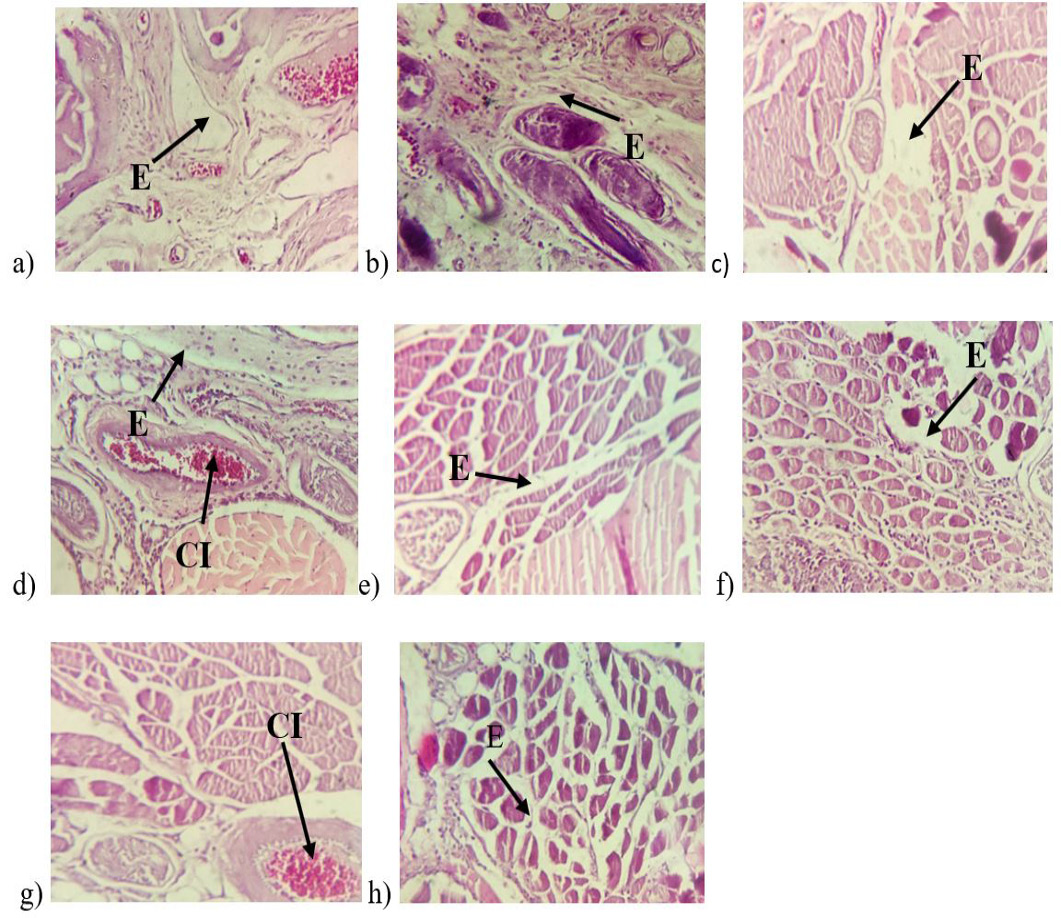
Figure 2:
(a) Sub-planter tissue of mice in negative control group, (b) positive control group, (c) M. alba 2%, (d) M. alba 1%, (e) M. alba 0.5%, (f) M. nigra 2%, (g) M. alba 1% and (h) M. nigra 0.5%. “E” represents edema and “CI” represents cell infiltration.