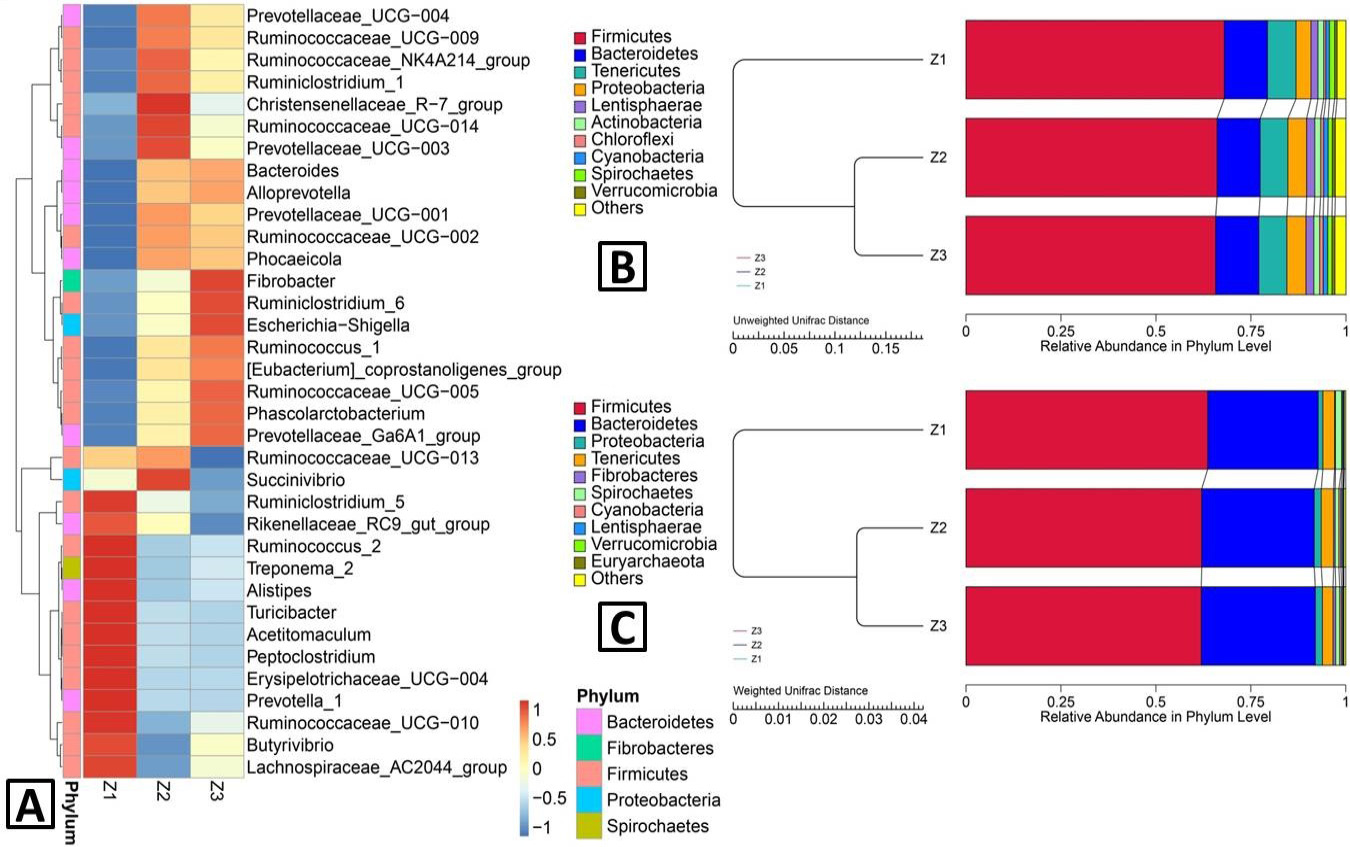
Heatmap and UPFMA (unweighted pair-group method with arithmetic mean) tree. A, The heatmap of clustering for species abundance. The information for the groups (Z1, Z2 and Z3) and the species mark were revealed along X-axis and Y-axis, respectively. The clustering tree was generated based on the relative abundance of the genera in the top 35. The relative abundance in the heatmap, which was described by colours after normalization, indicate the aggregation degree or content of the bacterial species among the samples at the genus level; B. UPMGA clustering trees—based on unweighted UniFrac distance; C, weighted UniFrac distance. The results of clustering using two distance matrices were combined with the overall percentages of relative abundance among all samples at the phylum level. Z3, adult; Z2, sub-adults; Z1, infant.