
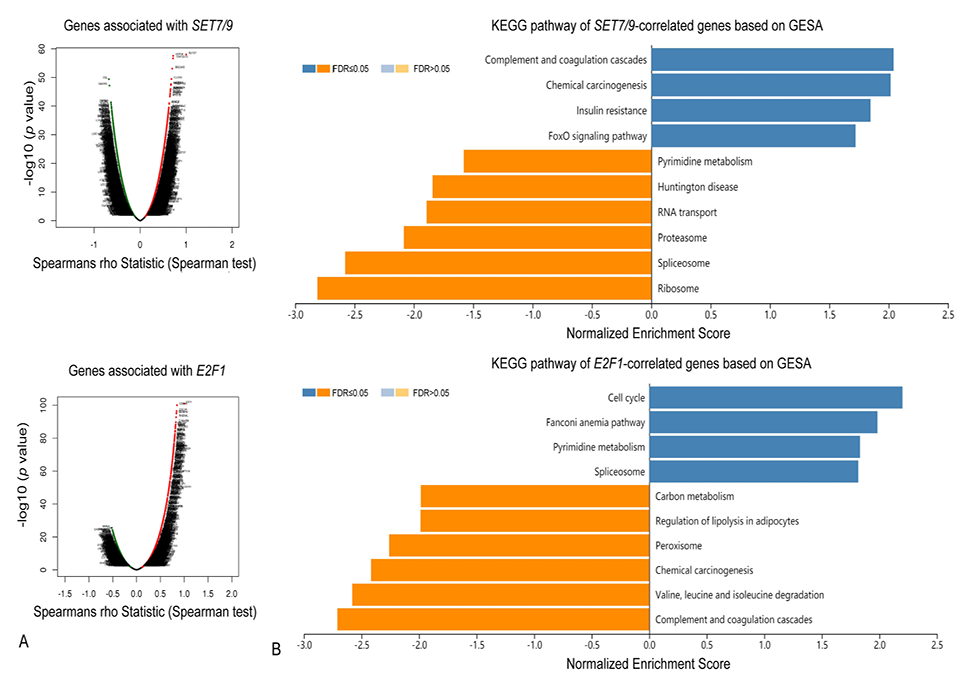
Fig. 5.
Enrichment analysis of SET7/9- and E2F1-correlated genes in HCC. (A) Genes positively (red) and negatively (green) correlated with SET7/9 and E2F1 in HCC identified by Spearman’s Correlation test of TCGA RNAseq data of 371 patients. (B) Top enriched KEGG pathways of SET7/9- and E2F1-correlated genes based on Gene Set Enrichment Analysis (GSEA). KEGG terms of positively and negatively correlated genes of SET7/9 and E2F1 are shown by blue and yellow bars, respectively.