
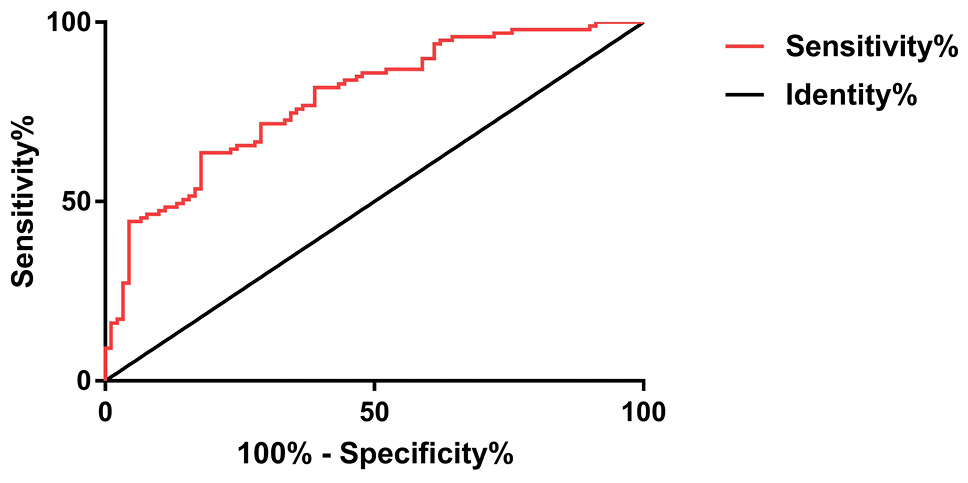
Fig. 5.
ROC curve of AMH levels predicting IVF-ET in clinical pregnancy in PCOS patients.
ROC curve analysis shows that the area below the curve is 0.783, 95% of CI is 0.586 to 0.826, the specificity is 77.52%, the sensitivity is 81.46%, the Youden index is 53.26, and the optimal cut-point is 7.149.