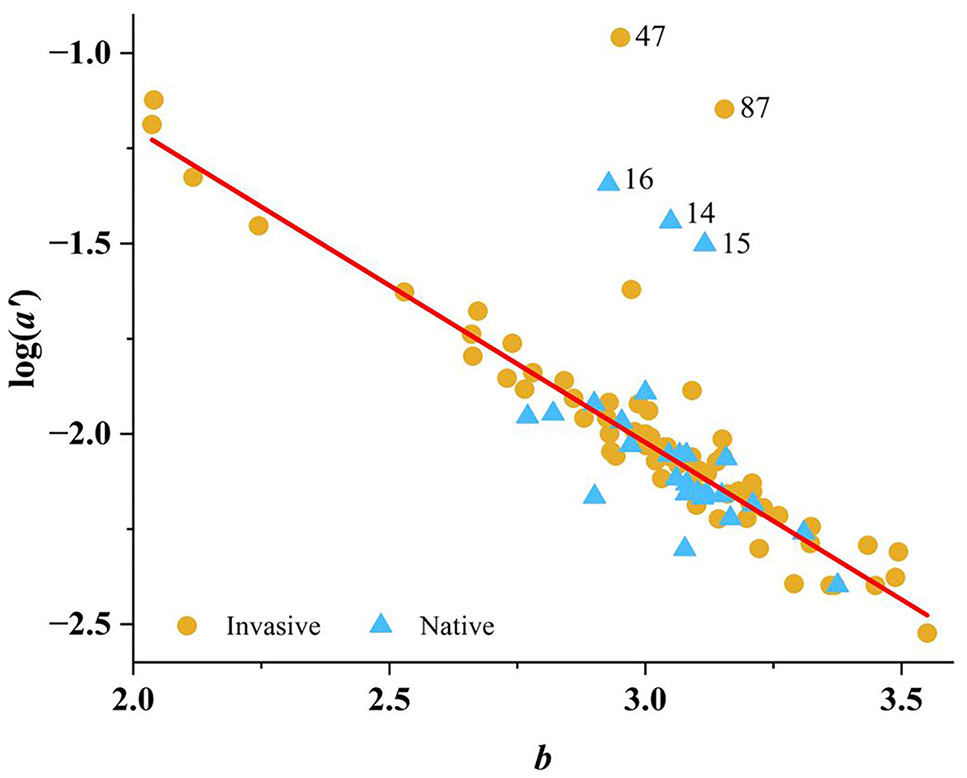
Fig. 3.
Plots of log (a’) vs b for 93 LWRs of P. parva. Five outliers were marked by row number of Supplementary Table I in the graphs, and eliminated in subsequent analysis. Regression line: log(a’) = 0.45 - 0.83b, n = 88, R2 = 0.84, P < 0.05.