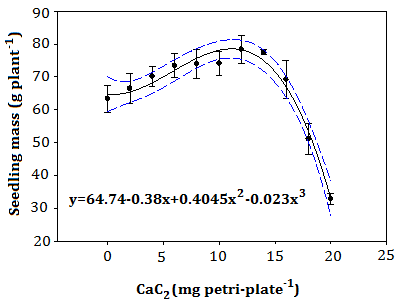
Figure 7:
Variations in biomass of C. annum seedlings due to application of calcium carbide under low temperature stress. The bold lines represent a fitted to the data while dotted lines show 95% confidence intervals. Vertical bars represent ± standard error of the mean.
