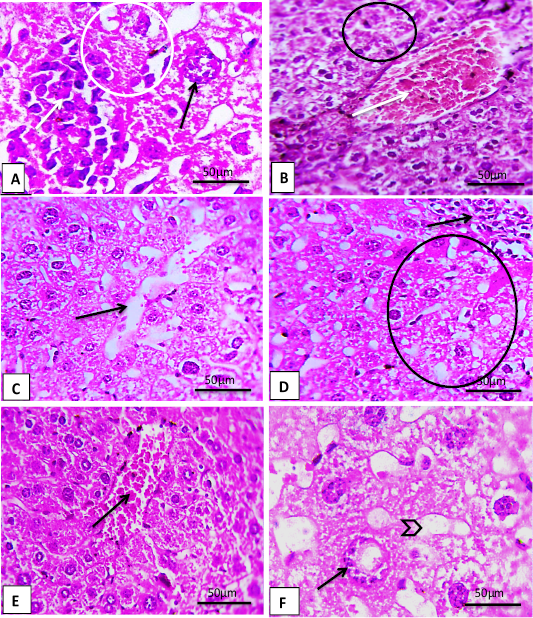
Figure 2:
Paraffin sections of experiment groups liver, (A 1000 X) H group liver note severe Inflammation infiltration (white arrow), necrosis (circle), and apoptosis state (black arrow), as well as (B 400X) shown a hemorrhage (white arrow), severe degeneration and vaculation of cytoplasm (circle), while (C 400X) note dilated sinusoids (black arrow). L group notes (D 400X) mild Inflammation infiltration (black arrow), and necrosis (circle), while (E 400X) shown a hemorrhage (black arrow), (F 100X) note apoptosis state (black arrow) and dilated sinusoids (arrow head). (H and E staining).