
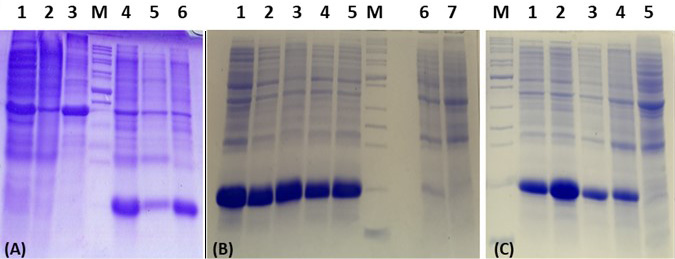
The expression of recombinant protein ZntR after IPTG induction (A) Lanes 1, 2, and 3: proteins from cell lysate, supernatant and pellet from control culture, respectively; Lanes 4, 5, and 6: proteins from cell lysate, supernatant, and pellet from culture expressing ZntR, respectively. Bands at 15kDa in lanes 4-6 represent ZntR protein. (B) Optimization of IPTG concentrations for ZntR expression. Lanes 1, 2, 3, 4 and 5: IPTG induction at concentrations of 0.01, 0.05, 0.1, 0.5 and 1 mM, respectively; Lane 6: No IPTG and lane 7: pET21 vector without ZntR insert. (C) Optimization of IPTG induction time. Lanes 1, 2, 3, and 4: IPTG induction for a time of 2, 4, 6, and 8 hr, respectively; Lane 5: No IPTG. Lane M: Protein ladder (Benchmark cat.no. 10747-012).