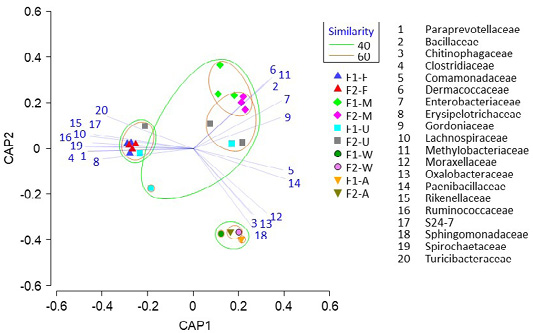
Figure 2:
Principal coordinate analysis exploring the differences betweenfecal, milk, uterine, airborne dust, and water microbiota in dairy farms. The operational taxonomy unit with Pearson’s correlation >0.7 is overlaid on the plot as vectors. F, fecal samples; M, milk samples; U, uterine samples; A, airborne dust samples; W, water samples; 1–2, the farm number.