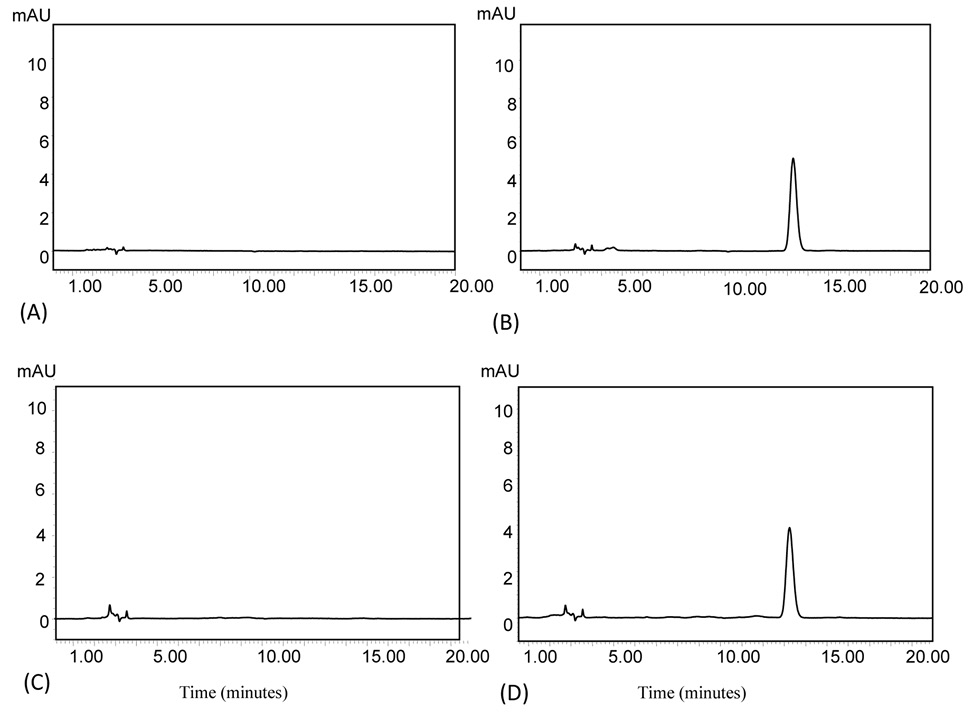
Fig. 1.
Chromatograms of blank standard (A), 1µg/ml of cefquinome standard solution (B), blank plasma (C) and 1µg/ml of cefquinome in plasma (D).
Chromatograms of blank standard (A), 1µg/ml of cefquinome standard solution (B), blank plasma (C) and 1µg/ml of cefquinome in plasma (D).