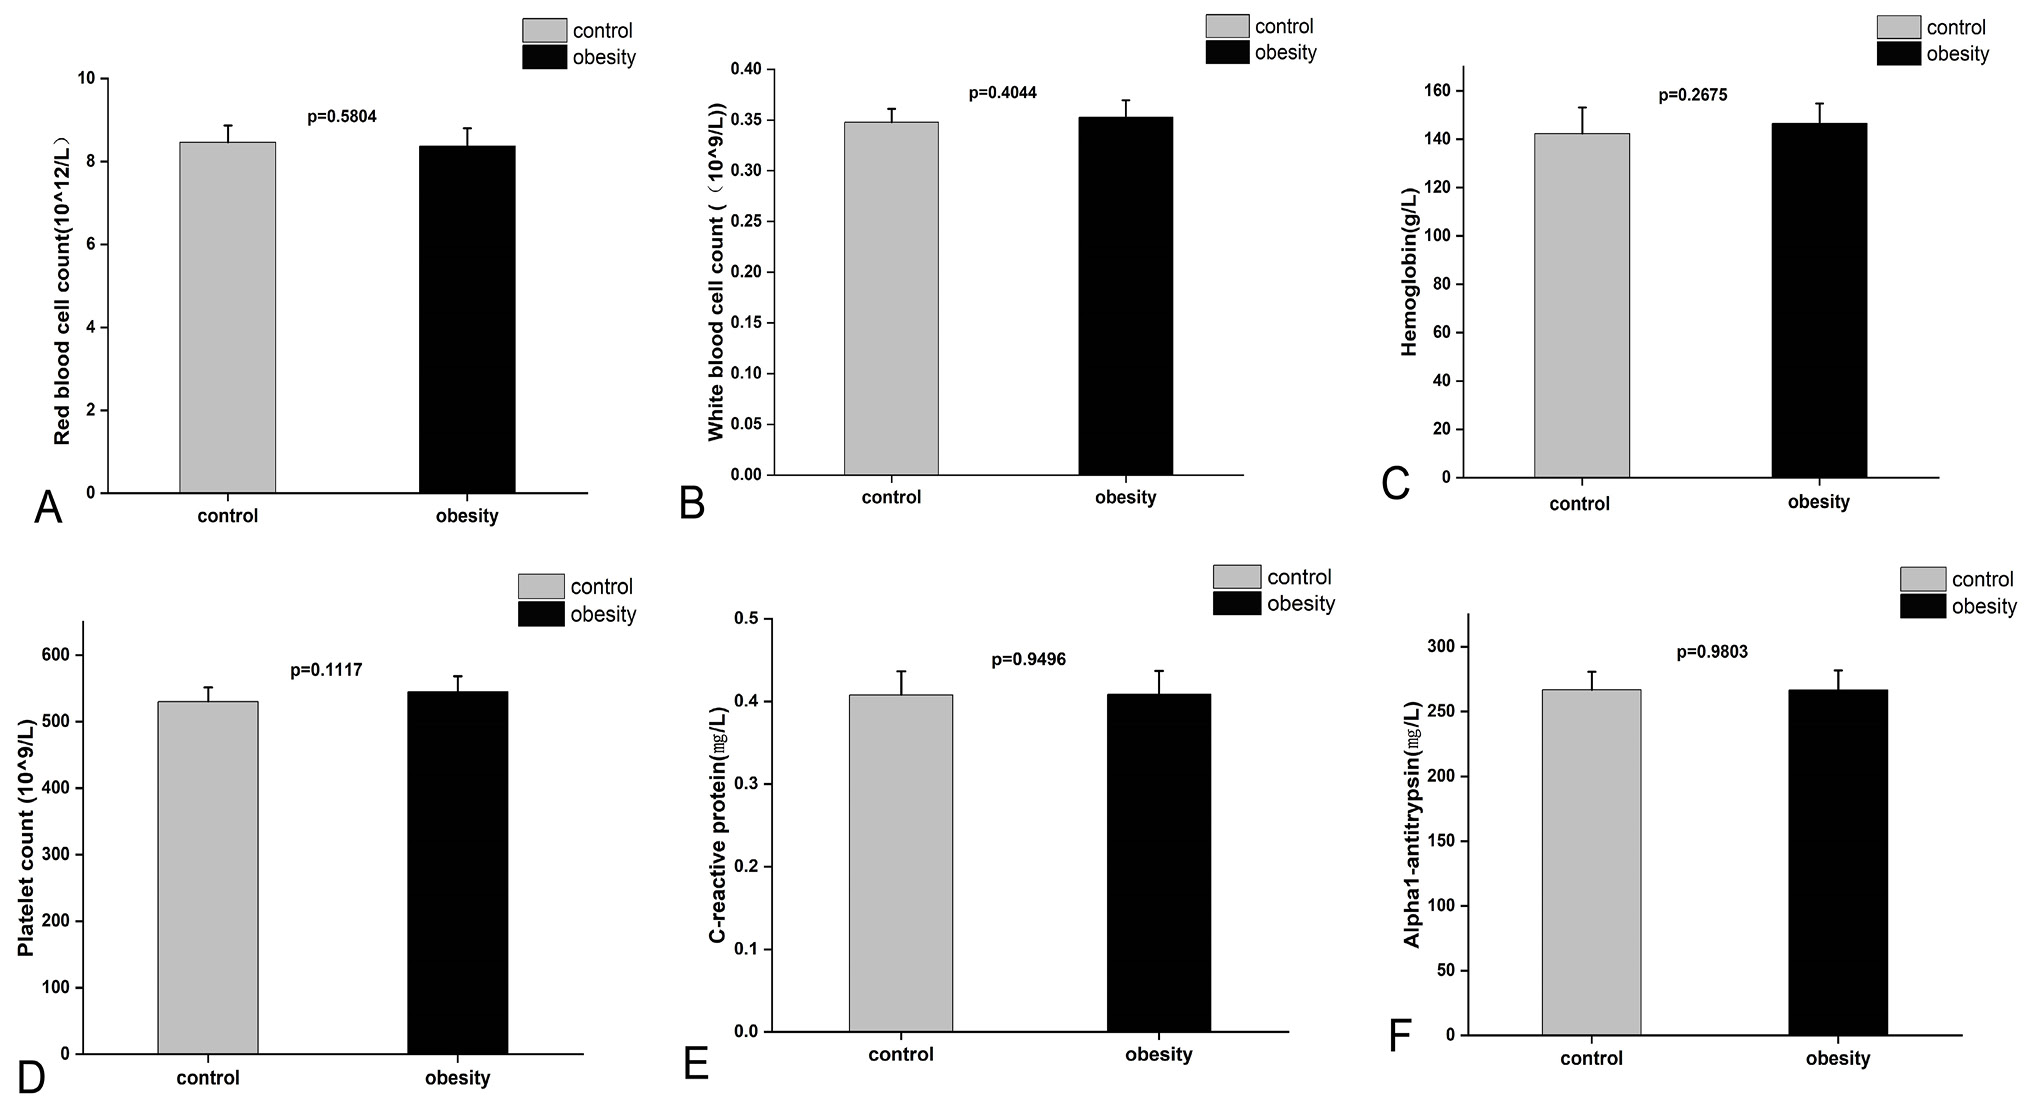
Fig. 3.
A, Red blood cell count levels in blood. B, White blood cell count levels in blood. C, Hemoglobin levels in blood. D, Platelet levels in blood. E, C-reactive protein concentration levels in blood. F, Alpha1-antitrypsin concentration levels in blood. Data are presented as mean ± SEM; N= 14 per group; statistical significance is indicated: *P < 0.05, ** P < 0.01.