
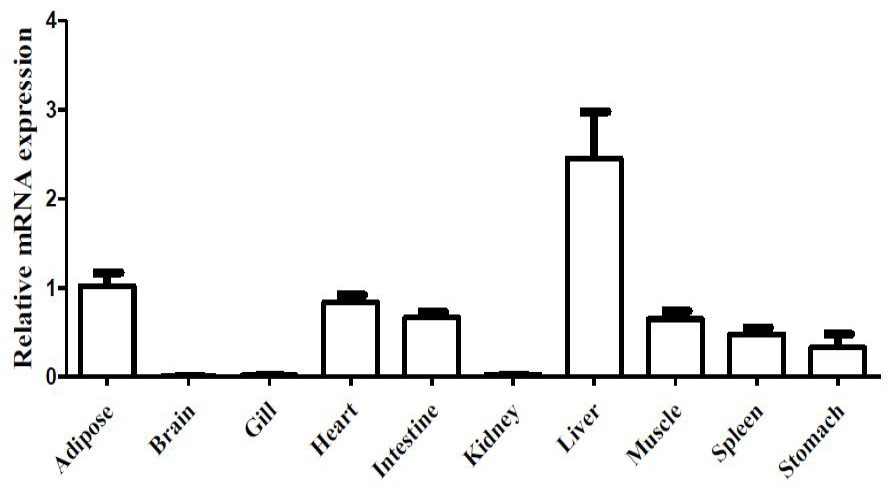
Fig. 5.
Tissue distribution pattern of leptin in darkbarbel catfish. Results were expressed as relative expression levels and normalized by the β-actin gene. Each error bar represents a standard error of the mean (n = 5).
Tissue distribution pattern of leptin in darkbarbel catfish. Results were expressed as relative expression levels and normalized by the β-actin gene. Each error bar represents a standard error of the mean (n = 5).