
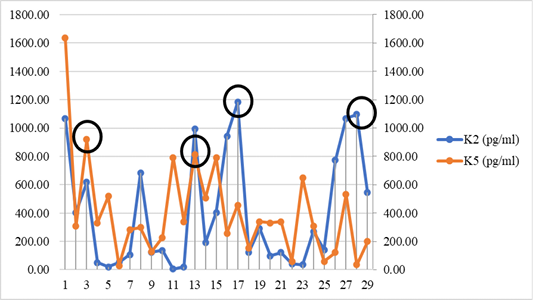
Figure 5:
Estrone Conjugare (E1C) hormone profiles of the female sumatran slow loris in cage no. 2 (K2) and in cage no.5 (K5) in captivity (pg/g) during study. Note: Black circles (O) indicate E1C peaks. Description: X axes = days and Y axes = E1C level (pg/g).