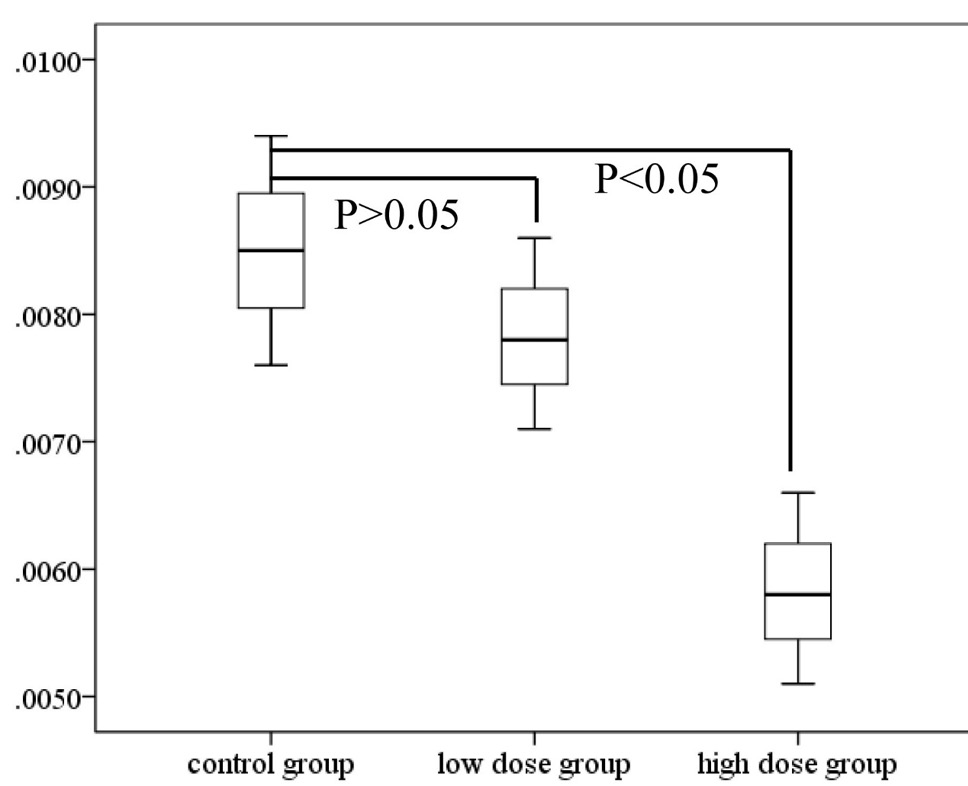
Fig. 3.
The testis organ index in control group, low dose group, high dose group are presented as mean ± standard deviation. Compared to the control group, P<0.05 is significantly difference. * P<0.05 is significantly difference versus control group.