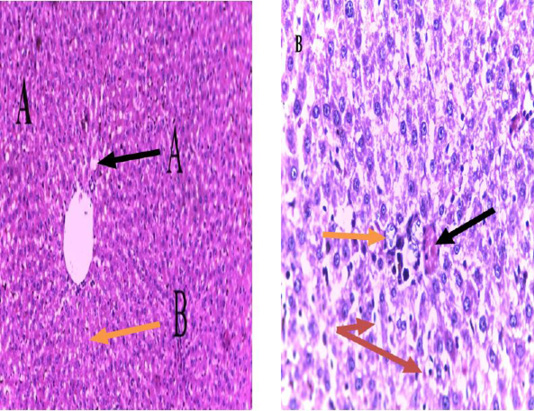
Figure 6:
Section in the liver of Puma (Super fat) group (One month) showing (A): simple enlargement of sinusoids (Black arrow) natural tissue (orange arrow). (B) Puma group (Two months) showing congestion (black arrow) hypertrophy of hepatocytes (orange arrow) enlargement of sinusoids (red arrow) stained by H&E, (A) (100 X) (B) (40 X).