View larger version:
Download Original File
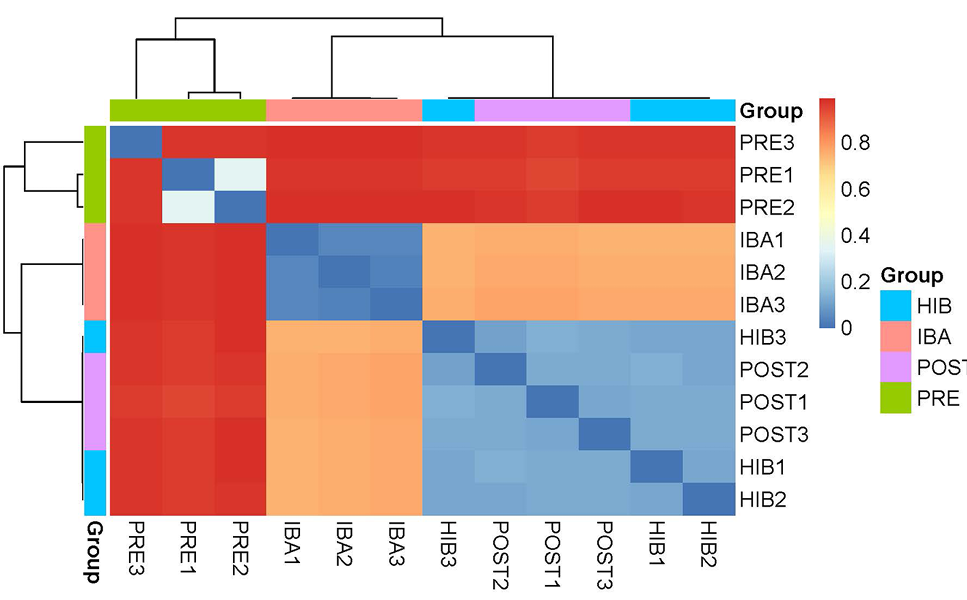
Fig. 5.
Beta diversity: Heatmap of the Bray-Curtis distance between each sample.