View larger version:
Download Original File
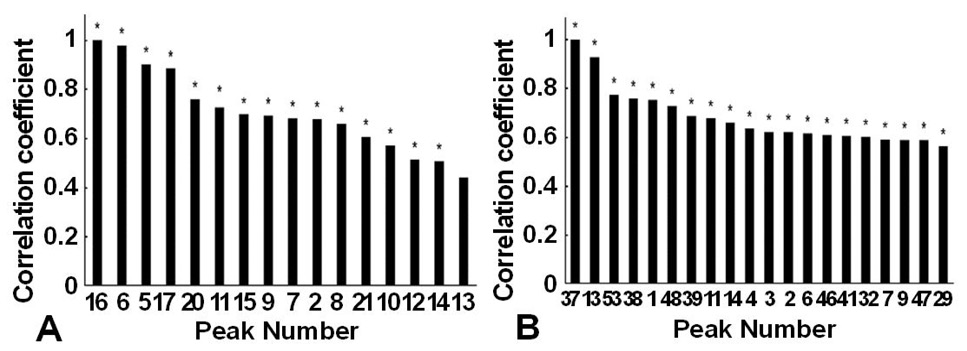
Fig. 3.
Grey relational analysis of estrogen activity and common peaks in serum TGs collected at different time points. (A) positive ion mode; (B) negative ion mode.
* correlation when the value of the correlation coefficient was >0.5.