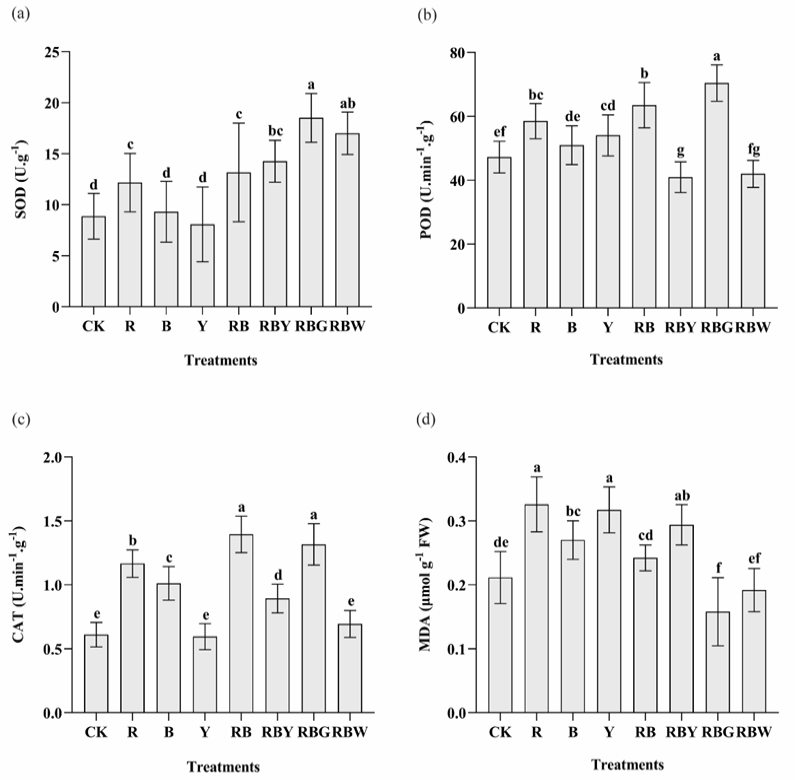
Figure 5:
Superoxide dismutase, peroxidase, catalase, and malondialdehyde enzyme activity in tissue culture seedlings of D. officinale under different light qualities. Different letters (a, b, c, d, e, f, g) indicate significant differences between treatments at P≤0.05 by using Duncan’s test. Vertical bars represent the standard deviation of the means (n = 10) in superoxide dismutase, peroxidase, and catalase whereas the standard deviation of the means (n = 6) in malondialdehyde.
