View larger version:
Download Original File
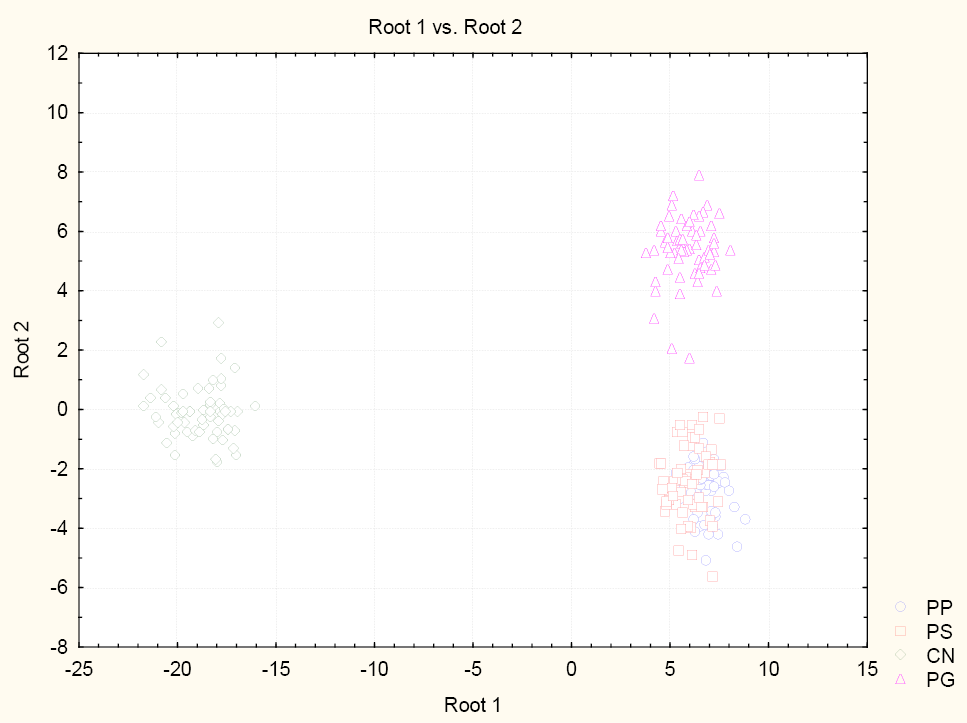
Fig. 5.
Scatter plot of discriminant function analysis (DF2 on DF1).