Fig. 2.
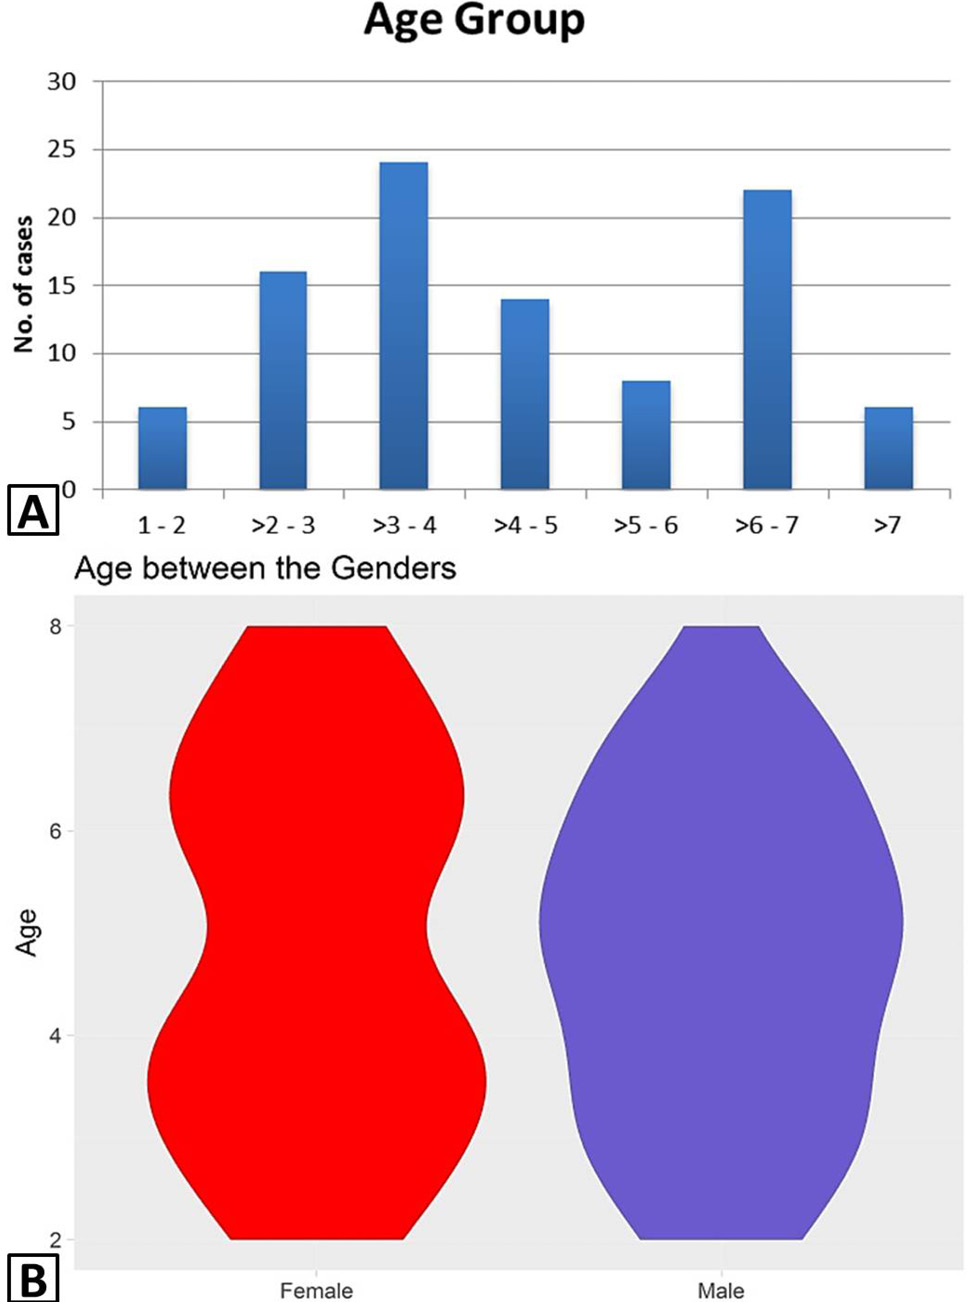
A, Districution of number of cases among different age groups; B, frequency of age among both genders represented by violin plots.
A, Districution of number of cases among different age groups; B, frequency of age among both genders represented by violin plots.