
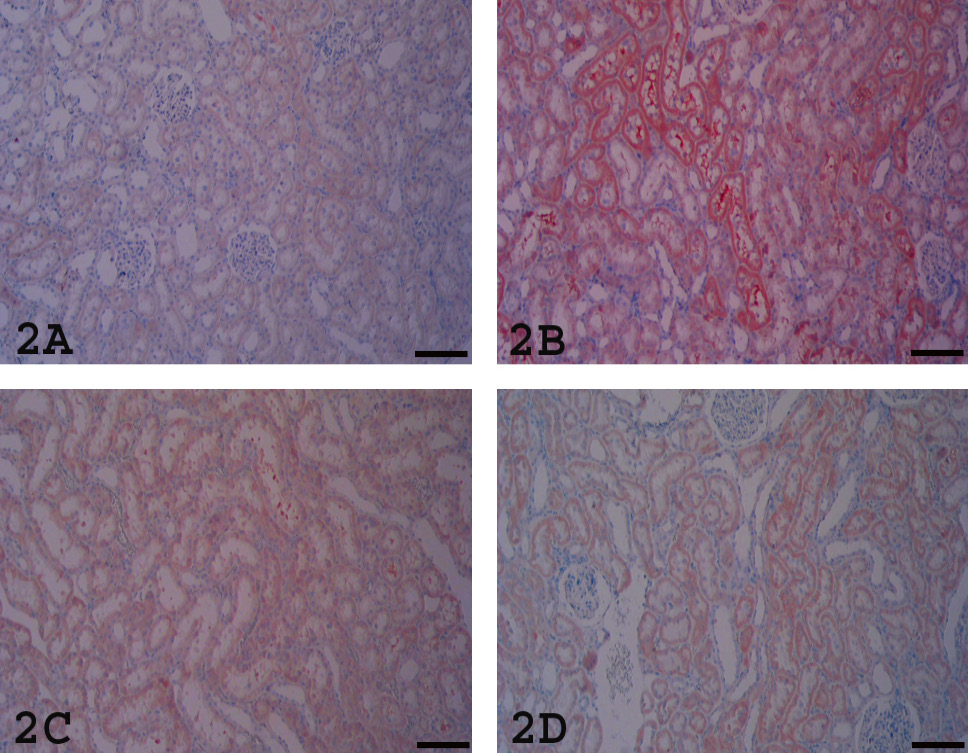
Fig. 2.
8-OHdG evaluation: kidneys stained with Streptavidin biotin peroxidase complex method with AEC chromogen and Mayer’s Hematoxylin counterstain, scale bar=150 µm. A, Control group is not showing specific positivity. B, CP group is showing specific cytoplasmic and luminal positivity of tubuli. C, CP+EA50 group is showing mild positivity. D, CP+EA75 group is showing quite improved results of less specific positivity.