View larger version:
Download Original File
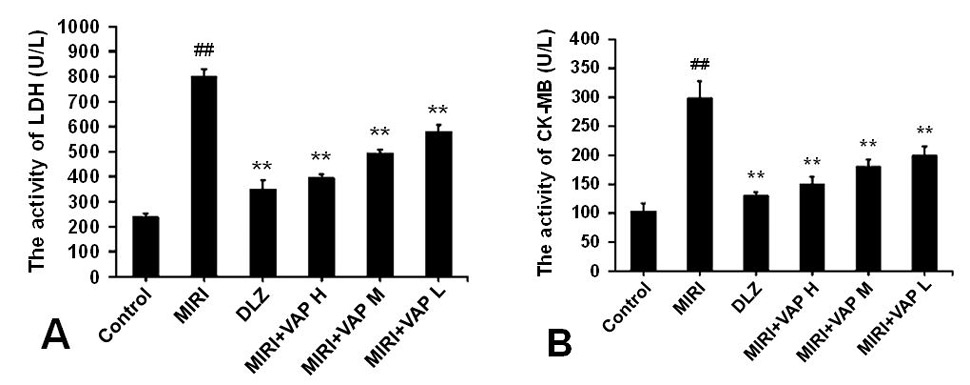
Fig. 2.
LDH (A) and CK-MB (B) activities in serum of each group.
Note: ## p<0.01, compared with control group; ** p<0.01, compared with MIRI group.