
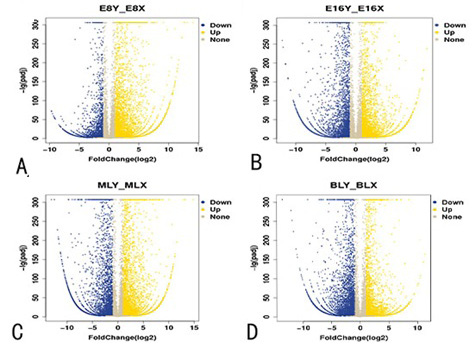
Fig. 2.
Volcano map showing differential expression genes (DEG) among female and male embryos in each period. The number of DEGs in XX and XY embryos; yellow represents upregulated genes, blue represents the downregulated genes, gray shows the difference that is not significant.