
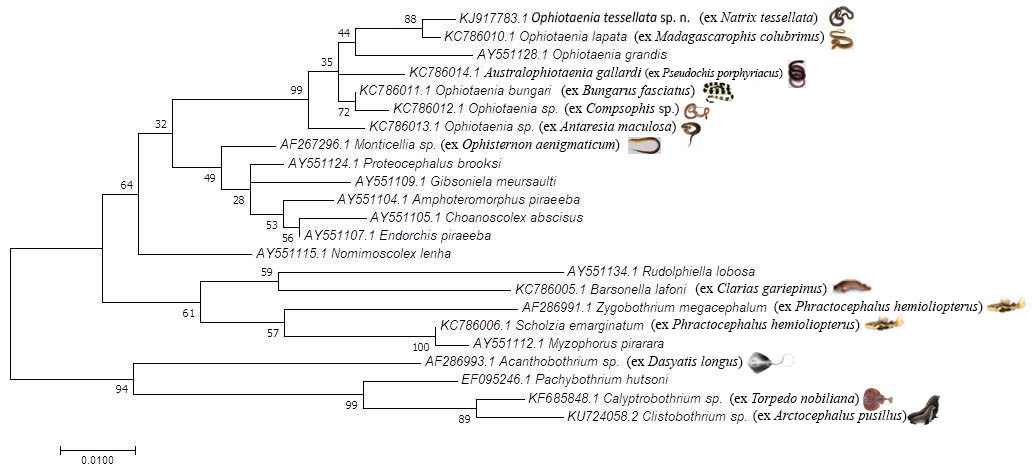
Molecular Phylogenetic analysis by Maximum Likelihood method based on 18S rRNA gene sequence of Ophiotaenia tessellata sp. n. Molecular Phylogenetic analysis by Maximum Likelihood method. The evolutionary history was inferred by using the Maximum Likelihood method based on the Tamura-Nei model. The tree with the highest log likelihood (-1795.64) is shown. The percentage of trees in which the associated taxa clustered together is shown next to the branches. Initial tree(s) for the heuristic search were obtained automatically by applying Neighbor-Join and BioNJ algorithms to a matrix of pairwise distances estimated using the Maximum Composite Likelihood (MCL) approach, and then selecting the topology with superior log likelihood value. The tree is drawn to scale, with branch lengths measured in the number of substitutions per site. The analysis involved 23 nucleotide sequences. All positions with less than 95% site coverage were eliminated. That is, fewer than 5% alignment gaps, missing data, and ambiguous bases were allowed at any position. There were a total of 453 positions in the final dataset. Evolutionary analyses were conducted in MEGA7.